|
|
市場調査レポート
商品コード
1382557
海水および汽水淡水化Seawater and Brackish Water Desalination |
||||||
|
|
|||||||


| 海水および汽水淡水化 |
|
出版日: 2023年11月16日
発行: BCC Research
ページ情報: 英文 128 Pages
納期: 即納可能
|
- 全表示
- 概要
- 図表
- 目次
世界の海水および汽水淡水化の市場規模は、2023年の174億米ドルから、予測期間中は8.1%のCAGRで推移し、2028年には257億米ドルの規模に成長すると予測されています。
地域別で見ると、中東・アフリカ市場は、2023年の90億米ドルから、同期間中9.3%のCAGRで推移し、2028年には140億米ドルの規模に成長すると予測されています。また、アジア太平洋地域市場は、2023年の40億米ドルから、7.0%のCAGRで推移し、2028年には56億米ドルの規模に成長すると予測されています。
当レポートでは、世界の海水および汽水淡水化の市場を調査し、市場および技術の概要、市場影響因子および市場機会の分析、市場規模の推移・予測、各種区分・地域別の詳細分析、技術および特許の動向、ESGの展開、競合情勢、主要企業のプロファイルなどをまとめています。
目次
第1章 イントロダクション
第2章 サマリー・ハイライト
- 市場の見通し
- 市場サマリー
第3章 市場概要
- 淡水化の定義
- 淡水化の歴史
- 世界の淡水化市場の概要
- 淡水化に使用される技術
- 淡水化システムの経済学:水単価
- 概要
- プラント容量と初期設備投資
- 淡水化技術のコストプロファイル
- 資本コスト推計:技術別
- 運営費と保守費
- エネルギーコストと炭素排出量
- 水単価合計
- 熱技術のコスト
- 将来の淡水化技術のコスト改善
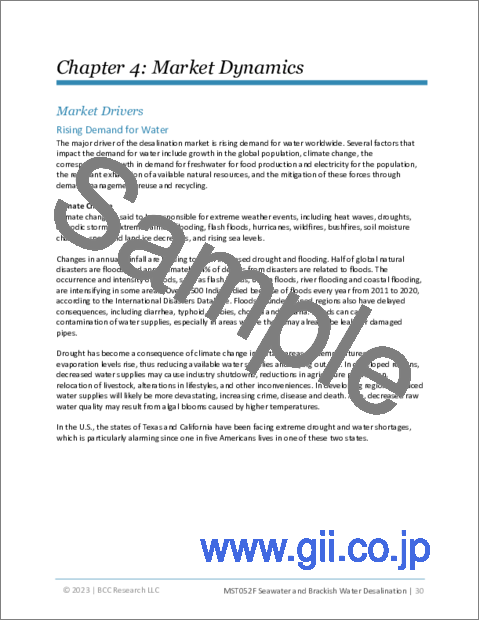
第4章 市場力学
- 市場促進要因
- 水需要の高まり
- 淡水化における技術の進歩
- 課題
- 脱塩をよりエネルギー効率と費用対効果の高いものに
- 塩水の廃棄
- 農業における脱塩水の再利用
第5章 新たな技術と開発
- グリーン淡水化の動向
- 新技術
- ドライテスト海水逆浸透(SWRO)膜
- 閉回路逆浸透(CCRO)
第6章 市場内訳:ソース別
- 海水
- 海水淡水化の利点
- 海水淡水化の障壁
- 汽水
第7章 市場内訳:技術別
- 膜
- 逆浸透
- 電気透析/ED/EDR
- ナノ濾過
- サーマル
- 多段フラッシュ蒸留
- 複効用蒸留
- その他の技術
- ハイブリッドシステム
- MSF/ROまたはMED/RO
- NF/MSF、NF/MED、NF/RO
- MED/TVC
第8章 市場内訳:エンドユーザー産業別
- 自治体
- 産業
- 石油・ガス
- 化学薬品
- 乳製品・食品・飲料
- 紙・パルプ
- 医薬品(製薬・バイオテクノロジー)
- 半導体
- 発電所
- その他の産業
- その他
第9章 市場内訳:地域別
- 北米
- 欧州
- アジア太平洋
- 中東・アフリカ
- ラテンアメリカ
第10章 業界の持続可能性:ESGの観点
- 海水淡水化業界におけるESG
- Hitachi ZosenにおけるESGの取り組み
- 環境への取り組み
- 社会への取り組み
- ガバナンスへの取り組み
- 結果
- BCCによる総論
第11章 特許分析
第12章 M&A
第13章 競合情報
第14章 企業プロファイル
- ACCIONA
- ALFA LAVAL AB
- AQUATECH INTERNATIONAL LLC
- BIWATER INTERNATIONAL LTD.
- DUPONT WATER SOLUTIONS
- GRADIANT CORP. INC.
- HANGZHOU WATER TREATMENT TECHNOLOGY DEVELOPMENT CENTER CO. LTD.
- HITACHI ZOSEN CORP.
- IDE TECHNOLOGIES
- KOVALUS SEPARATION SOLUTIONS
- LG CHEM
- PURE AQUA INC.
- TORAY INDUSTRIES INC.
- VEOLIA ENVIRONNEMENT S.A.
第15章 付録:頭字語
List of Tables
- Summary Table : Global Market for Seawater and Brackish Water Desalination, by Region, Through 2028
- Table 1 : Classification of Water Quality
- Table 2 : Comparison of Desalination Technologies
- Table 3 : Cost Profiles of Desalination Technologies
- Table 4 : Capital Costs for Desalination Methods
- Table 5 : Cost of Membrane Desalination, Before 1985 to 2022
- Table 6 : Forecast for Parameters for Seawater Desalination Plants
- Table 7 : Worldwide Urban Population and Rate of Urbanization, 2022
- Table 8 : 10 Most Populous Cities, 2023
- Table 9 : Global Population, Energy Consumption and Water Consumption for Energy Trends, 2005-2050
- Table 10 : Water Withdrawals by Sector, by Income Group, 2020
- Table 11 : 25 Most Water-Stressed Countries, 2030 and 2040
- Table 12 : Global Market for Seawater and Brackish Water Desalination, by Source, Through 2028
- Table 13 : Global Market for Seawater Desalination, by Region, Through 2028
- Table 14 : Global Market for Brackish Water Desalination, by Region, Through 2028
- Table 15 : Global Market for Seawater and Brackish Water Desalination, by Technology, Through 2028
- Table 16 : Global Market for RO Technology in Desalination, by Region, Through 2028
- Table 17 : Global Market for Electrodialysis/EDI/EDR in Desalination, by Region, Through 2028
- Table 18 : Global Market for Nanofiltration in Desalination, by Region, Through 2028
- Table 19 : Global Market for MSF Distillation in Desalination, by Region, Through 2028
- Table 20 : Global Market for MED Distillation in Desalination, by Region, Through 2028
- Table 21 : Global Market for Hybrid Systems in Desalination, by Region, Through 2028
- Table 22 : Global Market for Seawater and Brackish Water Desalination, by Application, Through 2028
- Table 23 : Global Market for Desalination in Municipal Applications, by Region, Through 2028
- Table 24 : Global Market for Desalination in Industrial Applications, by Region, Through 2028
- Table 25 : Global Market for Desalination, by Region, Through 2028
- Table 26 : North American Market for Desalination, by Country, Through 2028
- Table 27 : European Market for Desalination, by Country, Through 2028
- Table 28 : Asia-Pacific Market for Desalination, by Country, Through 2028
- Table 29 : Middle East and African Market for Desalination, by Country, Through 2028
- Table 30 : Latin American Market for Desalination, by Country, Through 2028
- Table 31 : ESG Metrics
- Table 32 : Analysis of ESG Diversity Issues
- Table 33 : Analysis of ESG Employee Safety and Labor Practices Issues
- Table 34 : Analysis of ESG Resource Efficiency and Emissions Issues
- Table 35 : Analysis of ESG Waste Reduction Issues
- Table 36 : Analysis of the ESG Sustainable Supply Chain
- Table 37 : Analysis of ESG Ethical Corporate Behavior
- Table 38 : ESG Scores of Desalination Companies
- Table 39 : Patents Related to Seawater Desalination, by Country of Origin, January 2020 to August 2023
- Table 40 : Patents Related to Brackish Water Desalination, by Country of Origin, January 2020 to August 2023
- Table 41 : Patents Related to Seawater Desalination, by Year Issued, January 2020 to August 2023
- Table 42 : Patents Related to Brackish Water Desalination, by Year Issued, January 2020 to August 2023
- Table 43 : Patents Related to Seawater Desalination, by Patent Holder, January 2020 to August 2023
- Table 44 : Patents Related to Brackish Water Desalination, by Patent Holder, January 2020 to August 2023
- Table 45 : List of Patents Related to Seawater Desalination, January 2022 to August 2023
- Table 46 : Patents Related to Brackish Desalination, January 2022-August 2023
- Table 47 : Mergers and Acquisitions, January 2020 to October 2023
- Table 48 : Acciona: Annual Revenue, 2022
- Table 49 : Acciona: Recent Developments, 2023
- Table 50 : Acciona: ESG Ratings
- Table 51 : Acciona: Desalination Portfolio
- Table 52 : Alfa Laval: Annual Revenue, 2022
- Table 53 : Alfa Laval: Recent Developments, 2021
- Table 54 : Alfa Laval: ESG Ratings
- Table 55 : Alfa Laval: Desalination Portfolio
- Table 56 : Aquatech International: Recent Developments, 2023
- Table 57 : Aquatech International: Desalination Portfolio
- Table 58 : BiWater International: Recent Developments, 2023
- Table 59 : BiWater International: Desalination Portfolio
- Table 60 : DuPont: Annual Revenue, 2022
- Table 61 : DuPont: Recent Developments, 2023
- Table 62 : DuPont: ESG Ratings
- Table 63 : DuPont Water Solutions: Desalination Portfolio
- Table 64 : Gradiant: Recent Developments, 2023
- Table 65 : Gradiant: Desalination Portfolio
- Table 66 : Hangzhou Water Treatment: Recent Developments, 2023
- Table 67 : Hangzhou Water Treatment: Desalination Portfolio
- Table 68 : Hitachi Zosen: Annual Revenue, 2022
- Table 69 : Hitachi Zosen: ESG Ratings
- Table 70 : Hitachi Zosen: Desalination Portfolio
- Table 71 : IDE Technologies: Recent Developments, 2023
- Table 72 : IDE Technologies: Desalination Portfolio
- Table 73 : Kovalus Separation Solutions: Recent Developments, 2023
- Table 74 : Kovalus Separation Solutions: Desalination Portfolio
- Table 75 : LG Chem: Annual Revenue, 2022
- Table 76 : LG Chem: ESG Ratings
- Table 77 : LG Chem: Recent Developments, 2023
- Table 78 : LG Chem: Desalination Portfolio
- Table 79 : Pure Aqua: Desalination Portfolio
- Table 80 : Toray Industries: Annual Revenue, 2023
- Table 81 : Toray Industries: ESG Ratings
- Table 82 : Toray Industries: Recent Developments, 2023
- Table 83 : Toray Industries: Desalination Portfolio
- Table 84 : Veolia Environnement: Annual Revenue, 2022
- Table 85 : Veolia Environnement: ESG Ratings
- Table 86 : Veolia Environnement: Recent Developments, 2023
- Table 87 : Veolia Environnement: Desalination Portfolio
- Table 88 : Acronyms Used in This Report
List of Figures
- Summary Figure : Global Market for Seawater and Brackish Water Desalination, by Region, 2022-2028
Figure A : Research Methodology: Bottom-Up Approach
- Figure 1 : Distribution Shares of Different Water Sources, 2022
- Figure 2 : Global Distribution of Desalination Capacity, by Region, 2022
- Figure 3 : Factors Affecting the Cost of Desalinated Water
- Figure 4 : CAPEX Breakdown-MED Plant
- Figure 5 : CAPEX Breakdown-SWRO Plant
- Figure 6 : Cost Allocation Shares of MSF Thermal Desalination Plants, by Component
- Figure 7 : Cost Allocation Shares of MED Thermal Desalination Plants, by Component
- Figure 8 : Global Population, Energy Consumption, and Water Consumption for Energy Trends, 2005-2050
- Figure 9 : Global Gap Between Existing Water Supply and Demand, 2030
- Figure 10 : Water-Stressed Areas of the World, 2040
- Figure 11 : Global Market Shares of Seawater and Brackish Water Desalination, by Source, 2022
- Figure 12 : Global Market Shares of Seawater and Brackish Water Desalination, by Technology, 2022
- Figure 13 : Global Market Shares of Seawater and Brackish Water Desalination, by End-User Industry, 2022
- Figure 14 : Global Market Shares of Desalination, by Region, 2022
- Figure 15 : Overview of ESG Factors
- Figure 16 : Global Market Shares of Desalination, by Company, 2022
- Figure 17 : Acciona: Annual Revenue, 2021 and 2022
- Figure 18 : Acciona: Revenue Shares, by Business Unit, 2022
- Figure 19 : Acciona: Revenue Shares, by Region, 2022
- Figure 20 : Alfa Laval: Annual Revenue, 2021 and 2022
- Figure 21 : Alfa Laval: Revenue Shares, by Business Unit, 2022
- Figure 22 : Alfa Laval: Revenue Shares, by Region, 2022
- Figure 23 : DuPont: Annual Revenue, 2021 and 2022
- Figure 24 : DuPont: Revenue Shares, by Business Unit, 2022
- Figure 25 : DuPont: Revenue Shares, by Region, 2022
- Figure 26 : Hitachi Zosen: Annual Revenue, 2021 and 2022
- Figure 27 : Hitachi Zosen: Revenue Shares, by Business Unit, 2022
- Figure 28 : Hitachi Zosen: Revenue Shares, by Region, 2022
- Figure 29 : LG Chem: Annual Revenue, 2021 and 2022
- Figure 30 : LG Chem: Revenue Shares, by Business Unit, 2022
- Figure 31 : LG Chem: Revenue Shares, by Region, 2022
- Figure 32 : Toray Industries: Annual Revenue, 2022 and 2023
- Figure 33 : Toray Industries: Revenue Shares, by Business Unit, 2023
- Figure 34 : Toray Industries: Revenue Shares, by Country/Region, 2023
- Figure 35 : Veolia Environnement: Annual Revenue, 2021 and 2022
- Figure 36 : Veolia Environnement S.A.: Revenue Shares, by Business Unit, 2022
- Figure 37 : Veolia Environnement: Revenue Shares, by Region, 2022
Highlights:
The global market for seawater and brackish water desalination is estimated to increase from $17.4 billion in 2023 to reach $25.7 billion by 2028, at a compound annual growth rate (CAGR) of 8.1% from 2023 through 2028.
Middle Eastern and African seawater and brackish water desalination is estimated to increase from $9.0 billion in 2023 to reach $14.0 billion by 2028, at a compound annual growth rate (CAGR) of 9.3% from 2023 through 2028.
Asia-Pacific seawater and brackish water desalination is estimated to increase from $4.0 billion in 2023 to reach $5.6 billion by 2028, at a compound annual growth rate (CAGR) of 7.0% from 2023 through 2028.
##img_0##
Report Scope:
There are five sources of water for the desalination industry: brackish, seawater, brine, river, and pure water. This report covers only seawater and brackish water, which together account for more than 85% of the desalination industry. Brackish water and seawater are both types of salt water, but these sources differ by total dissolved solids (TDS). Each type of water requires different treatment methods. Brackish water is a blend of freshwater and seawater, characterized by a lower salt concentration than seawater. Seawater refers to the saline water naturally occurring in the ocean with a higher salt content.
Desalination plants range from small to large industrial or municipal facilities. This study discusses the status of global water resources and the growing gap between freshwater resources and demand for water from all sectors. The specific growth drivers for and the challenges related to the evolution of the desalination equipment market are presented.
A technical overview of the primary desalination technologies is provided on the basis of membrane- and thermal-based technologies, as well as an overview of novel desalination methods. This updated version includes a study of the industrial segment, including the oil and gas, chemical, dairy, food and beverage, paper and pulp, pharmaceutical, semiconductor, and power industry and refinery sectors. The report presents the hypothetical unit cost of water as produced by the primary technologies as well as the sensitivity of that cost to variations in economic parameters.
The report also features a chapter highlighting the sustainability perspective of the seawater and brackish water desalination market at the global level. The chapter covers companies' performance in terms of ESG parameters.
The market size and estimates are provided in terms of value ($ millions), with 2022 serving as the base year and market forecasts given for the period 2023 to 2028. Regional-level market sizes, with respect to technology and application, are also provided.
Report Includes:
- 37 data tables and 52 additional tables
- An overview of the global market for seawater and brackish water desalination
- Estimates of the market size and analyses of global market trends with data from 2022 and 2023, and projections of compound annual growth rates (CAGRs) through 2028
- An examination of the current and future market potential, and breakdowns of the market by water source, technology, application, and geographic region
- Descriptions of the primary desalination technologies and methods, and an assessment of the global seawater and brackish water desalination plant industry, from both market and application perspectives
- In-depth information (facts and figures) pertaining to the major factors influencing the market, including emerging technologies and recent M&A activity
- Insight into the industry structure, current competitive landscape, R&D activities, and regulatory and legislative issues
- Analysis of relevant patents
- Profiles of companies in the desalination industry, including Veolia Environnement, Acciona, LG Chem, and DuPont
Table of Contents
Chapter 1 Introduction
- Study Goals and Objectives
- Reasons for Doing this Study
- Scope of Report
- What's New in This Update
- Research Methodologies
- Information Sources
- Geographical Breakdown
- Segmentation Breakdown
Chapter 2 Summary and Highlights
- Market Outlook
- Market Summary
Chapter 3 Market Overview
- Definition of Desalination
- History of Desalination
- Overview of the Global Market for Water Desalination
- Technologies Used in Water Desalination
- Desalination System Economics: Unit Cost of Water
- Overview
- Plant Capacity and Initial Capital Investment
- Cost Profiles of Desalination Technologies
- Capital Cost Estimates, by Technology
- Operating and Maintenance Costs
- Energy Costs and Carbon Emissions
- All-In Unit Cost of Water
- Cost of Thermal Technologies
- Future Cost Improvements in Desalination Technologies
Chapter 4 Market Dynamics
- Market Drivers
- Rising Demand for Water
- Technological Advances in Desalination
- Challenges
- Making Desalination More Energy-Efficient and Cost-Effective
- Disposal of Brine
- Reuse of Desalted Water in Agriculture
Chapter 5 Emerging Technologies and Developments
- Trends in Green Desalination
- Emerging Technologies
- Dry-Test Seawater Reverse Osmosis (SWRO) Membrane
- Closed Circuit Reverse Osmosis (CCRO)
Chapter 6 Market Breakdown by Source
- Introduction
- Seawater
- Advantages of Seawater Desalination
- Barriers to Seawater Desalination
- Brackish Water
Chapter 7 Market Breakdown by Technology
- Introduction
- Membranes
- Reverse Osmosis
- Electrodialysis/ED/EDR
- Nanofiltration
- Thermal
- Multi-Stage Flash Distillation
- Multi-Effect Distillation
- Other Technologies
- Hybrid Systems
- MSF/RO or MED/RO
- NF/MSF, NF/MED, NF/RO
- MED/TVC
Chapter 8 Market Breakdown by End-User Industry
- Introduction
- Municipal
- Industrial
- Oil & Gas
- Chemical
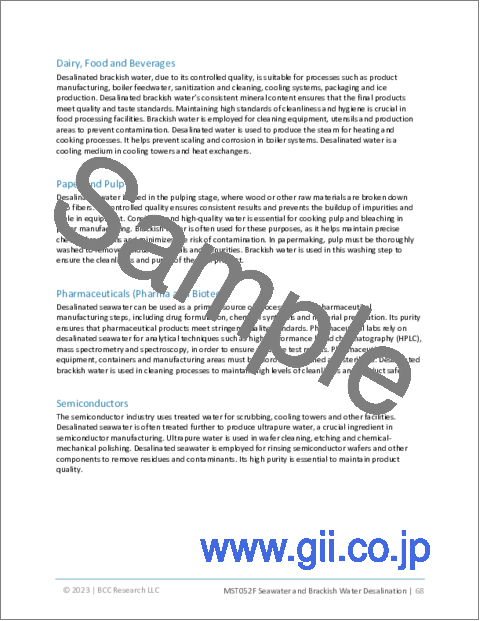
- Dairy, Food and Beverages
- Paper and Pulp
- Pharmaceuticals (Pharma and Biotech)
- Semiconductors
- Power Plants
- Other Industries
- Others
Chapter 9 Market Breakdown by Region
- Introduction
- North America
- Europe
- Asia-Pacific
- Middle East and Africa
- Latin America
Chapter 10 Sustainability in the Industry: An ESG Perspective
- ESG in the Desalination Industry
- ESG Implementation at Hitachi Zosen
- Environmental Initiatives
- Social Initiatives
- Governance Initiatives
- Outcomes
- Concluding Remarks from BCC
Chapter 11 Patent Analysis
- Significance of Patents
- Patent Analysis Based on Country of Origin
- Patent Analysis Based on Year Issued
- Patent Analysis Based on Patent Holders
Chapter 12 Mergers and Acquisitions
- M&A Analysis
Chapter 13 Competitive Intelligence
- Industry Structure
Chapter 14 Company Profiles
- ACCIONA
- ALFA LAVAL AB
- AQUATECH INTERNATIONAL LLC
- BIWATER INTERNATIONAL LTD.
- DUPONT WATER SOLUTIONS
- GRADIANT CORP. INC.
- HANGZHOU WATER TREATMENT TECHNOLOGY DEVELOPMENT CENTER CO. LTD.
- HITACHI ZOSEN CORP.
- IDE TECHNOLOGIES
- KOVALUS SEPARATION SOLUTIONS
- LG CHEM
- PURE AQUA INC.
- TORAY INDUSTRIES INC.
- VEOLIA ENVIRONNEMENT S.A.