|
|
市場調査レポート
商品コード
1332775
ワイヤレスセンサー:各種技術と世界市場Wireless Sensors: Technologies and Global Markets |
||||||
|
|
|||||||


| ワイヤレスセンサー:各種技術と世界市場 |
|
出版日: 2023年08月16日
発行: BCC Research
ページ情報: 英文 208 Pages
納期: 即納可能
|
- 全表示
- 概要
- 図表
- 目次
世界のワイヤレスセンサーの市場規模は、2023年の123億米ドルから、予測期間中は21.4%のCAGRで推移し、2028年には324億米ドルの規模に成長すると予測されています。
測定可能パラメーター別で見ると、生物学的特性の部門が2023年の29億米ドルから、22.8%のCAGRで推移し、2028年には81億米ドルの規模に成長すると予測されています。また、監視・画像の部門は2023年の13億米ドルから、25.3%のCAGRで推移し、2028年には41億米ドルの規模に成長すると予測されています。
当レポートでは、世界のワイヤレスセンサーの市場を調査し、市場概要、市場影響因子および市場機会の分析、市場規模の推移・予測、各種区分・地域別の詳細分析、新たな技術と開発の動向、ESGの展開、競合情勢、主要企業のプロファイルなどをまとめています。
目次
第1章 イントロダクション
第2章 サマリー・ハイライト
第3章 市場概要
- 概要
- センサーの基礎
- ワイヤレスセンサー
- IoTとWSN
- メッシュネットワーク
- センサーのライフサイクル評価
- 技術のライフサイクル
- 規制・基準
- 無線センサーネットワークの規制
- IoTセンサーネットワークの規制
- バリューチェーン分析
- ポーターのファイブフォース分析
- COVID-19の市場への影響
- ロシア・ウクライナ戦争が市場に与える影響
第4章 市場力学
- 概要
- 市場促進要因
- スマートファクトリーコンセプトの出現と産業オートメーションの急速な導入
- 製造拠点の移動
- ワイヤレス技術の採用の増加
- スマートシティの成長
- 市場機会
- さまざまな無線規格間の相乗効果/連携と産業用途での使用の増加
- リモート監視のためのさまざまなアプリケーションでワイヤレスセンサーの採用が増加
- IIoTの成長
- 環境モニタリング (エコロジー) および農業におけるワイヤレスセンサーの可能性の高まり
- 市場抑制要因
- WSNのセキュリティとプライバシーの問題
第5章 市場内訳:測定可能パラメーター別
- 概要
- ワイヤレス生物学的特性センサー
- ワイヤレスモーションセンサーと位置センサー
- ワイヤレス温度センサー
- ワイヤレスフローセンサー
- ワイヤレス監視・画像センサー
- ワイヤレスレベルセンサー
- ワイヤレス圧力センサー
- ワイヤレス湿度センサー
- ワイヤレス化学組成センサー
第6章 市場内訳:無線規格/技術別
- 概要
- 規格・技術
- ZigBeeとRF4CE
- Bluetooth
- Wi-Fi・6LoWPAN
- RFID
- その他
第7章 市場内訳:エンドユーズ別
- 概要
- ホームオートメーション
- エネルギーインフラ
- ヘルスケア
- 産業オートメーション
- 生態・農業
- 防衛・監視
- 物流・輸送
- その他
第8章 市場内訳:地域別
- 概要
- 北米
- 欧州
- アジア太平洋
- その他の地域
第9章 環境・社会・ガバナンス (ESG) の観点
- 概要
- ワイヤレスセンサー市場におけるESGパフォーマンス
- 環境面の影響
- 社会面の影響
- ガバナンス面の影響
- ワイヤレスセンサー市場におけるESGの現状
- ワイヤレスセンサー市場における主要なESG問題
- ワイヤレスセンサー市場におけるESGに対する消費者の態度
- ケーススタディ
- BCCによる総論
第10章 新たな技術と開発
- 市場動向分析
- ワイヤレスセンサーの価格動向に影響を与える要因
- 市場における新興技術
- LPWAN
- 5Gとその先へ
- エッジコンピューティング
- 環境発電
- AI・ML
- センサーフュージョン
- IoT
- ウェアラブルセンサー
第11章 特許分析
- 概要
- 地理的パターン
第12章 競合情勢
- 主要企業
第13章 企業プロファイル
- ABB LTD.
- ANALOG DEVICES INC.
- ARUBA NETWORKS(HEWLETT-PACKARD ENTERPRISE)
- BANNER ENGINEERING CORP.
- DIGI INTERNATIONAL
- EMERSON ELECTRIC CO.
- ENDRESS+HAUSER
- ENOCEAN
- HONEYWELL INTERNATIONAL INC.
- INFINEON TECHNOLOGIES AG
- JACOBS ENGINEERING INC.
- KCF TECHNOLOGIES
- LORD MICROSTRAIN SENSING SYSTEMS
- MICROSEMI CORP.(MICROCHIP TECHNOLOGY)
- MOOG CROSSBOW
- NXP SEMICONDUCTOR INC.
- ROBERT BOSCH GMBH
- ROCKWELL AUTOMATION
- SCHNEIDER ELECTRIC
- SIEMENS AG
- STMICROELECTRONICS N.V.
- TE CONNECTIVITY
- TEXAS INSTRUMENTS INC.
- TYCO INTERNATIONAL PLC(JOHNSON CONTROLS INTERNATIONAL PLC)
- UNITED TECHNOLOGIES CORP.
第14章 付録:略語
List of Tables
- Summary Table : Global Market for Wireless Sensors, by Measurable Parameter, Through 2028
- Table 1 : Porter's Five Forces Analysis: Overview
- Table 2 : Global Market for Wireless Sensors, by Measurable Parameter, Through 2028
- Table 3 : Global Market for Wireless Biological Characteristic Sensors, by Region, Through 2028
- Table 4 : Global Market for Wireless Motion and Position Sensors, by Region, Through 2028
- Table 5 : Global Market for Wireless Temperature Sensors, by Region, Through 2028
- Table 6 : Global Market for Wireless Flow Sensors, by Region, Through 2028
- Table 7 : Global Market for Wireless Surveillance and Image Sensors, by Region, Through 2028
- Table 8 : Global Market for Wireless Level Sensors, by Region, Through 2028
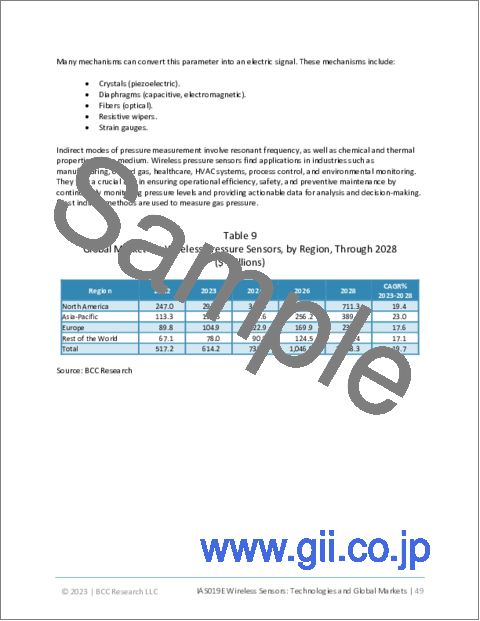
- Table 9 : Global Market for Wireless Pressure Sensors, by Region, Through 2028
- Table 10 : Global Market for Wireless Humidity Sensors, by Region, Through 2028
- Table 11 : Global Market for Wireless Chemical Composition Sensors, by Region, Through 2028
- Table 12 : Global Market for Wireless Sensors, by Wireless Standard/Technology, Through 2028
- Table 13 : Global Market for ZigBee and RF4CE Sensors, by Region, Through 2028
- Table 14 : Global Market for Bluetooth Sensors, by Region, Through 2028
- Table 15 : Global Market for Wi-Fi and 6LoWPAN Sensors, by Region, Through 2028
- Table 16 : Global Market for RFID Sensors, by Region, Through 2028
- Table 17 : Global Market for Other Wireless Standard Sensors, by Region, Through 2028
- Table 18 : Global Market for Wireless Sensors, by End-Use Application, Through 2028
- Table 19 : Global Market for Wireless Sensors in Home Automation Applications, by Region, Through 2028
- Table 20 : Global Market for Wireless Sensors in Energy Infrastructure Applications, by Region, Through 2028
- Table 21 : Global Market for Wireless Sensors in Healthcare Applications, by Region, Through 2028
- Table 22 : Global Market for Wireless Sensors in Industrial Automation Applications, by Region, Through 2028
- Table 23 : Global Market for Wireless Sensors in Ecology and Agriculture Applications, by Region, Through 2028
- Table 24 : Global Market for Wireless Sensors in Defense and Surveillance Applications, by Region, Through 2028
- Table 25 : Global Market for Wireless Sensors in Logistics and Transport Applications, by Region, Through 2028
- Table 26 : Global Market for Wireless Sensors in Other End-Use Applications, by Region, Through 2028
- Table 27 : Global Market for Wireless Sensors, by Region, Through 2028
- Table 28 : North American Market for Wireless Sensors, by Measurable Parameter, Through 2028
- Table 29 : North American Market for Wireless Sensors, by Wireless Standard/Technology, Through 2028
- Table 30 : North American Market for Wireless Sensors, by End-Use Application, Through 2028
- Table 31 : European Market for Wireless Sensors, by Measurable Parameter, Through 2028
- Table 32 : European Market for Wireless Sensors, by Wireless Standard/Technology, Through 2028
- Table 33 : European Market for Wireless Sensors, by End-Use Application, Through 2028
- Table 34 : Asia-Pacific Market for Wireless Sensors, by Measurable Parameter, Through 2028
- Table 35 : Asia-Pacific Market for Wireless Sensors, by Wireless Standard/Technology, Through 2028
- Table 36 : Asia-Pacific Market for Wireless Sensors, by End-Use Application, Through 2028
- Table 37 : Rest of the World Market for Wireless Sensors, by Measurable Parameter, Through 2028
- Table 38 : Rest of the World Market for Wireless Sensors, by Wireless Standard/Technology, Through 2028
- Table 39 : Rest of the World Market for Wireless Sensors, by End-Use Application, Through 2028
- Table 40 : ESG Risk Ratings Metric, by Company, 2022
- Table 41 : Global Patents on Wireless Sensors, 2022 and 2023
- Table 42 : Market Share of Top Wireless Sensors Providers, 2022
- Table 43 : ABB Ltd.: Annual Revenue, FY 2022
- Table 44 : ABB Ltd.: Recent Developments, 2022
- Table 45 : ABB Ltd.: Product Portfolio
- Table 46 : Analog Devices Inc.: Annual Revenue, FY 2022
- Table 47 : Hewlett-Packard Enterprise: Annual Revenue, FY 2022
- Table 48 : Banner Engineering Corp.: Recent Developments, 2022
- Table 49 : Banner Engineering Corp.: Product Portfolio
- Table 50 : Emerson Electric Co.: Annual Revenue, FY 2022
- Table 51 : Emerson Electric Co.: Product Portfolio
- Table 52 : Endress+Hauser: Annual Revenue, FY 2022
- Table 53 : Endress+Hauser: Product Portfolio
- Table 54 : Honeywell International Inc.: Annual Revenue, FY 2022
- Table 55 : Infineon Technologies AG: Annual Revenue, FY 2022
- Table 56 : Jacobs Engineering Inc.: Annual Revenue, FY 2022
- Table 57 : Jacobs Engineering Inc.: Product Portfolio
- Table 58 : NXP Semiconductor Inc.: Annual Revenue, FY 2022
- Table 59 : NXP Semiconductor Inc.: Recent Developments, 2023
- Table 60 : Robert Bosch GmbH: Annual Revenue, FY 2022
- Table 61 : Robert Bosch GmbH: Product Portfolio
- Table 62 : Rockwell Automation Inc.: Annual Revenue, FY 2022
- Table 63 : Schneider Electric SE: Annual Revenue, FY 2022
- Table 64 : Siemens AG: Annual Revenue, FY 2022
- Table 65 : STMicroelectronics N.V.: Annual Revenue, FY 2022
- Table 66 : TE Connectivity: Annual Revenue, FY 2022
- Table 67 : Texas Instruments Inc.: Annual Revenue, FY 2022
- Table 68 : Texas Instruments Inc.: Recent Developments, 2023
- Table 69 : Johnson Controls International PLC: Annual Revenue, FY 2022
- Table 70 : Abbreviations Used in This Report
List of Figures
- Summary Figure : Global Market Shares of Wireless Sensors, by Measurable Parameter, 2022
- Figure 1 : Wireless Sensors Value Chain Analysis
- Figure 2 : Wireless Sensors Market: Porter's Five Forces Analysis
- Figure 3 : Wireless Sensors Market: Bargaining Power of Suppliers
- Figure 4 : Wireless Sensors Market: Bargaining Power of Consumers
- Figure 5 : Wireless Sensors Market: Threat of New Entrants
- Figure 6 : Wireless Sensors Market: Competitive Rivalry
- Figure 7 : Global Market Shares of Wireless Sensors, by Measurable Parameter, 2022
- Figure 8 : Global Market Shares of Wireless Biological Characteristic Sensors, by Region, 2022
- Figure 9 : Global Market Shares of Wireless Motion and Position Sensors, by Region, 2022
- Figure 10 : Global Market Shares of Wireless Temperature Sensors, by Region, 2022
- Figure 11 : Global Market Shares of Wireless Flow Sensors, by Region, 2022
- Figure 12 : Global Market Shares of Wireless Surveillance and Image Sensors, by Region, 2022
- Figure 13 : Global Market Shares of Wireless Level Sensors, by Region, 2022
- Figure 14 : Global Market Shares of Wireless Pressure Sensors, by Region, 2022
- Figure 15 : Global Market Shares of Wireless Humidity Sensors, by Region, 2022
- Figure 16 : Global Market Shares of Wireless Chemical Composition Sensors, by Region, 2022
- Figure 17 : Global Market Shares of Wireless Sensors, by Wireless Standard/Technology, 2022
- Figure 18 : Global Market Shares of ZigBee and RF4CE Sensors, by Region, 2022
- Figure 19 : Global Market Shares of Bluetooth Sensors, by Region, 2022
- Figure 20 : Global Market Shares of Wi-Fi and 6LoWPAN Sensors, by Region, 2022
- Figure 21 : Global Market Shares of RFID Sensors, by Region, 2022
- Figure 22 : Global Market Shares of Other Wireless Standard Sensors, by Region, 2022
- Figure 23 : Global Market Shares of Wireless Sensors, by End-Use Application, 2022
- Figure 24 : Global Market Shares of Wireless Sensors in Home Automation Applications, by Region, 2022
- Figure 25 : Global Market Shares of Wireless Sensors in Energy Infrastructure Applications, by Region, 2022
- Figure 26 : Global Market Shares of Wireless Sensors in Healthcare Applications, by Region, 2022
- Figure 27 : Global Market Shares of Wireless Sensors in Industrial Automation Applications, by Region, 2022
- Figure 28 : Global Market Shares of Wireless Sensors in Ecology and Agriculture Applications, by Region, 2022
- Figure 29 : Global Market Shares of Wireless Sensors in Defense and Surveillance Applications, by Region, 2022
- Figure 30 : Global Market Shares of Wireless Sensors in Logistics and Transport Applications, by Region, 2022
- Figure 31 : Global Market Shares of Wireless Sensors in Other End-Use Applications, by Region, 2022
- Figure 32 : Global Market Shares of Wireless Sensors, by Region, 2022
- Figure 33 : North American Market Shares of Wireless Sensors, by Measurable Parameter, 2022
- Figure 34 : North American Market Shares of Wireless Sensors, by Wireless Standard/Technology, 2022
- Figure 35 : North American Market Shares of Wireless Sensors, by End-Use Application, 2022
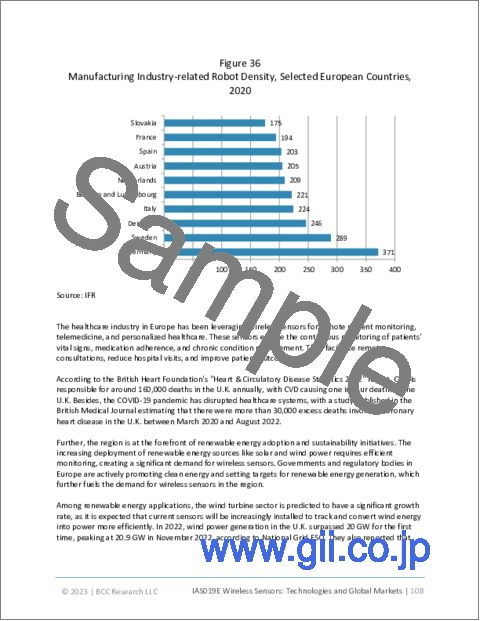
- Figure 36 : Manufacturing Industry-related Robot Density, Selected European Countries, 2020
- Figure 37 : European Market Shares of Wireless Sensors, by Measurable Parameter, 2022
- Figure 38 : European Market Shares of Wireless Sensors, by Wireless Standard/Technology, 2022
- Figure 39 : European Market Shares of Wireless Sensors, by End-Use Application, 2022
- Figure 40 : Asia-Pacific Market Shares of Wireless Sensors, by Measurable Parameter, 2022
- Figure 41 : Asia-Pacific Market Shares of Wireless Sensors, by Wireless Standard/Technology, 2022
- Figure 42 : Asia-Pacific Market Shares of Wireless Sensors, by End-Use Application, 2022
- Figure 43 : Rest of the World Market Shares of Wireless Sensors, by Measurable Parameter, 2022
- Figure 44 : Rest of the World Market Shares of Wireless Sensors, by Wireless Standard/Technology, 2022
- Figure 45 : Rest of the World Market Shares of Wireless Sensors, by End-Use Application, 2022
- Figure 46 : Emerging Technologies in the Wireless Sensors Market
- Figure 47 : Share of Published Wireless Sensors Related Patents and Patent Applications, by Key Country, 2022 and 2023
- Figure 48 : ABB Ltd.: Annual Revenue, 2021 and 2022
- Figure 49 : ABB Ltd.: Revenue Shares, by Business Unit, FY 2022
- Figure 50 : ABB Ltd.: Revenue Shares, by Region, FY 2022
- Figure 51 : Analog Devices Inc.: Annual Revenue, 2021 and 2022
- Figure 52 : Analog Devices Inc.: Revenue Shares, by Business Segment, FY 2022
- Figure 53 : Analog Devices Inc.: Revenue Shares, by Sales Channel, FY 2022
- Figure 54 : Analog Devices Inc.: Revenue Shares, by Region/Country, FY 2022
- Figure 55 : Hewlett-Packard Enterprise: Annual Revenue, 2021 and 2022
- Figure 56 : Hewlett-Packard Enterprise: Revenue Shares, by Business Unit, FY 2022
- Figure 57 : Hewlett-Packard Enterprise: Revenue Shares, by Region/Country, FY 2022
- Figure 58 : Emerson Electric Co.: Annual Revenue, 2021 and 2022
- Figure 59 : Emerson Electric Co.: Revenue Shares, by Business Platform, FY 2022
- Figure 60 : Emerson Electric Co.: Revenue Shares, by Region, FY 2022
- Figure 61 : Endress+Hauser: Annual Revenue, 2021 and 2022
- Figure 62 : Endress+Hauser: Revenue Shares, by Products, FY 2022
- Figure 63 : Endress+Hauser: Revenue Shares, by Region, FY 2022
- Figure 64 : Honeywell International Inc.: Annual Revenue, 2021 and 2022
- Figure 65 : Honeywell International Inc.: Revenue Shares, by Segment, FY 2022
- Figure 66 : Honeywell International Inc.: Revenue Shares, by Region/Country, FY 2022
- Figure 67 : Infineon Technologies AG: Annual Revenue, 2021 and 2022
- Figure 68 : Infineon Technologies AG: Revenue Shares, by Business Segment, FY 2022
- Figure 69 : Infineon Technologies AG: Revenue Shares, by Region/Country, FY 2022
- Figure 70 : Jacobs Engineering Inc.: Annual Revenue, 2021 and 2022
- Figure 71 : Jacobs Engineering Inc.: Revenue Shares, by Business Unit, FY 2022
- Figure 72 : Jacobs Engineering Inc.: Revenue Shares, by Region/Country, FY 2022
- Figure 73 : NXP Semiconductor Inc.: Annual Revenue, 2021 and 2022
- Figure 74 : NXP Semiconductor Inc.: Revenue Shares, by End Market, FY 2022
- Figure 75 : NXP Semiconductor Inc.: Revenue Shares, by Sales Channel, FY 2022
- Figure 76 : NXP Semiconductor Inc.: Revenue Shares, by Region, FY 2022
- Figure 77 : Robert Bosch GmbH: Annual Revenue, 2021 and 2022
- Figure 78 : Robert Bosch GmbH: Revenue Shares, by Business Segment, FY 2022
- Figure 79 : Robert Bosch GmbH: Revenue Shares, by Region, FY 2022
- Figure 80 : Rockwell Automation Inc.: Annual Revenue, 2021 and 2022
- Figure 81 : Rockwell Automation Inc.: Revenue Shares, by Segment, FY 2022
- Figure 82 : Rockwell Automation Inc.: Revenue Shares, by Region, 2022
- Figure 83 : Schneider Electric SE: Annual Revenue, 2021 and 2022
- Figure 84 : Schneider Electric SE: Revenue Shares, by Segment, FY 2022
- Figure 85 : Schneider Electric SE: Revenue Shares, by Region, FY 2022
- Figure 86 : Siemens AG: Annual Revenue, 2021 and 2022
- Figure 87 : Siemens AG: Revenue Shares, by Business Segment, FY 2022
- Figure 88 : Siemens AG: Revenue Shares, by Region, FY 2022
- Figure 89 : STMicroelectronics N.V.: Annual Revenue, 2021 and 2022
- Figure 90 : STMicroelectronics N.V.: Revenue Shares, by Product Group, FY 2022
- Figure 91 : STMicroelectronics N.V.: Revenue Shares, by Region, FY 2022
- Figure 92 : TE Connectivity: Annual Revenue, 2021 and 2022
- Figure 93 : TE Connectivity: Revenue Shares, by Business Segment, FY 2022
- Figure 94 : TE Connectivity: Revenue Shares, by Region, FY 2022
- Figure 95 : Texas Instruments Inc.: Annual Revenue, 2021 and 2022
- Figure 96 : Texas Instruments Inc.: Revenue Shares, by Business Segment, FY 2022
- Figure 97 : Texas Instruments Inc.: Revenue Shares, by Region/Country, FY 2022
- Figure 98 : Johnson Controls International PLC: Annual Revenue, 2021 and 2022
- Figure 99 : Johnson Controls International PLC: Revenue Shares, by Segment, FY 2022
- Figure 100 : Johnson Controls International PLC: Revenue Shares, by Region, FY 2022
Highlights:
The global wireless sensors market should reach $32.4 billion by 2028 from $12.3 billion in 2023 at a compound annual growth rate (CAGR) of 21.4% for the forecast period of 2023 to 2028.
Biological characteristics segment of the global wireless sensors market is expected to grow from $2.9 billion in 2023 to $8.1 billion in 2028 at a CAGR of 22.8% for the forecast period of 2023 to 2028.
Surveillance and image segment of the global wireless sensors market is expected to grow from $1.3 billion in 2023 to $4.1 billion in 2028 at a CAGR of 25.3% for the forecast period of 2023 to 2028.
Report Scope:
The scope of the report includes an overview of the global wireless sensors market as well as the analysis of global market trends. The data included in the report considers 2022 as the base year, and estimates for 2023 through 2028, with projections of CAGR in the forecast period. Revenue forecasts for this period are segmented based on measurable parameters, wireless standard/technology, end-use application and geography.
The report also offers an in-depth analysis of the competitive landscape within the wireless sensors market, focusing on key dynamics that drive success. It examines critical factors such as research and development capabilities, market presence, brand strength, and the influence of ecosystems and partnerships. The report includes profiles of wireless sensor manufacturers, providing valuable insights into their strategies and offerings. Additionally, the report assesses the impact of the COVID-19 pandemic on the market, considering the challenges and opportunities that have emerged as a result.
Report Includes:
- 57 data tables and 14 additional tables
- An updated overview of global markets for the wireless sensor applications
- Analyses of market trends, with data from 2022, estimates for 2023, and projections of compound annual growth rates (CAGRs) through 2028
- Estimation of the market size for wireless sensor technologies, both in value and volumetric terms, and corresponding market share analysis by type of wireless sensor standard/technology, measurable parameter, application, and geographic region
- Description of the technology and innovations behind wireless sensor development and production; and analysis of opportunities, deterrents, and trends affecting the growth of this market
- Details of numerous wireless sensors technologies such as RFID, ZigBee, RF4CE and EnOcean and comparison between Bluetooth and Bluetooth smart sensors
- Coverage of events like mergers and acquisitions, joint ventures, collaborations or partnerships, and other key strategies adopted by leading players in the wireless sensors market
- Market share analysis of various manufacturers/suppliers of various wireless sensors, and their product overviews and competitive landscape
- Company profiles of major industry players of the industry, including ABB Ltd., Emerson Electric Co., Jacobs Engineering Inc., Robert Bosch GmbH and Texas Instruments Inc.
Table of Contents
Chapter 1 Introduction
- Overview
- Reasons for Doing This Study
- Study Goals and Objectives
- What's New in This Update?
- Scope of Report
- Methodology
- Information Sources
- Geographic Breakdown
Chapter 2 Summary and Highlights
- Market Outlook
- Market Summary
Chapter 3 Market Overview
- Overview
- Fundamentals of Sensors
- Wireless Sensors
- IoT and WSN
- Mesh Networks
- Sensor Life Cycle Assessment
- Technology Life Cycle
- Regulatory Standards
- Regulation of Wireless Sensor Networks
- Regulation of IoT Sensor Networks
- Value Chain Analysis
- Porter's Five Forces Analysis
- Bargaining Power of Suppliers
- Bargaining Power of Consumers
- Threat of New Entrants
- Competitive Rivalry
- Threat of Substitutes
- Assessment of the Impact of COVID-19 on the Market
- Assessment of the Impact of Russia-Ukraine War on the Market
Chapter 4 Market Dynamics
- Overview
- Market Drivers
- Emergence of Smart Factory Concepts and Rapid Adoption of Industrial Automation
- Shifting Manufacturing Locations
- Increasing Adoption of Wireless Technologies
- The Growth of Smart Cities
- Market Opportunities
- Synergies/Collaborations between Various Wireless Standards and Their Increasing Usage in Industrial Applications
- Increased Adoption of Wireless Sensors Across Various Applications for Remote Monitoring
- The Growth of Industrial IoT (IIoT)
- Rising Potential for Wireless Sensors in Environmental Monitoring (Ecology) and Agriculture
- Market Restraints
- Security and Privacy Issues of WSNs
Chapter 5 Market Breakdown by Measurable Parameter
- Overview
- Wireless Biological Characteristic Sensors
- Wireless Motion and Position Sensors
- Wireless Temperature Sensors
- Wireless Flow Sensors
- Wireless Surveillance and Image Sensors
- Wireless Level Sensors
- Wireless Pressure Sensors
- Wireless Humidity Sensors
- Wireless Chemical Composition Sensors
Chapter 6 Market Breakdown by Wireless Standard/Technology
- Overview
- 802.15.4 Standard/Technology
- ZigBee and RF4CE
- Bluetooth
- Wi-Fi and IPv6 over Low-power Wireless Personal Area Networks (6LoWPAN)
- RFID
- Others
Chapter 7 Market Breakdown by End-Use Application
- Overview
- Home Automation
- Energy Infrastructure
- Healthcare
- Industrial Automation
- Ecology and Agriculture
- Defense and Surveillance
- Logistics and Transport
- Others
Chapter 8 Market Breakdown by Region
- Overview
- North America
- Europe
- Asia-Pacific
- Rest of the World
Chapter 9 Environmental, Social, and Governance (ESG) Perspective
- Overview
- ESG Performance in Wireless Sensors Market
- Environmental Impact
- Social Impact
- Governance Impact
- Current Status of ESG in the Wireless Sensors Market
- Key ESG Issues in the Wireless Sensors Market
- Consumer Attitudes Towards ESG in Wireless Sensors Market
- Case Study
- Concluding Remarks from BCC
Chapter 10 Emerging Technologies and Developments
- Market Trend Analysis
- Factors Influencing Wireless Sensor Price Trends
- Emerging Technologies in the Market
- Low-Power Wide-Area Networks (LPWAN)
- 5G and Beyond
- Edge Computing
- Energy Harvesting
- AI and ML
- Sensor Fusion
- Internet of Things (IoT)
- Wearable Sensors
Chapter 11 Patent Analysis
- Overview
- Geographical Patterns
Chapter 12 Competitive Landscape
- Top Companies
Chapter 13 Company Profiles
- ABB LTD.
- ANALOG DEVICES INC.
- ARUBA NETWORKS (HEWLETT-PACKARD ENTERPRISE)
- BANNER ENGINEERING CORP.
- DIGI INTERNATIONAL
- EMERSON ELECTRIC CO.
- ENDRESS+HAUSER
- ENOCEAN
- HONEYWELL INTERNATIONAL INC.
- INFINEON TECHNOLOGIES AG
- JACOBS ENGINEERING INC.
- KCF TECHNOLOGIES
- LORD MICROSTRAIN SENSING SYSTEMS
- MICROSEMI CORP. (MICROCHIP TECHNOLOGY)
- MOOG CROSSBOW
- NXP SEMICONDUCTOR INC.
- ROBERT BOSCH GMBH
- ROCKWELL AUTOMATION
- SCHNEIDER ELECTRIC
- SIEMENS AG
- STMICROELECTRONICS N.V.
- TE CONNECTIVITY
- TEXAS INSTRUMENTS INC.
- TYCO INTERNATIONAL PLC (JOHNSON CONTROLS INTERNATIONAL PLC)
- UNITED TECHNOLOGIES CORP.