|
|
市場調査レポート
商品コード
1177489
エッジコンピューティングの世界市場:コンポーネント別、アプリケーション別、エンドユーザー別、地域別、国別 - 市場規模、考察、競合、COVID-19の影響、予測Global Edge Computing Market - Analysis By Component, Application, End-User, By Region, By Country: Market Size, Insights, Competition, Covid-19 Impact and Forecast |
||||||
|
|
|||||||


| エッジコンピューティングの世界市場:コンポーネント別、アプリケーション別、エンドユーザー別、地域別、国別 - 市場規模、考察、競合、COVID-19の影響、予測 |
|
出版日: 2022年12月31日
発行: Azoth Analytics
ページ情報: 英文 300 Pages
納期: 即納可能
|
- 全表示
- 概要
- 図表
- 目次
世界のエッジコンピューティングの市場規模は、2021年に228億5,000万米ドルと評価されました。エッジコンピューティング市場は、低遅延性能、帯域幅需要の削減、データセキュリティと主権などの主要なサービス要件を伴うユースケースの拡大に後押しされ、非常にダイナミックな市場となっています。
当レポートでは、世界のエッジコンピューティング市場について調査分析し、市場力学、COVID-19の影響、セグメント別の市場分析と予測、競合情勢などについて、最新の情報を提供しています。
目次
第1章 イントロダクション
第2章 エグゼクティブサマリー
第3章 調査手法
第4章 市場力学
- 促進要因
- 抑制要因
- 機会
- 動向
- 市場力学の影響評価
第5章 バリューチェーン分析
- ハードウェアベンダー
- アプリケーション/ソフトウェア
- エッジコンピューティングソリューションベンダー
- 最終用途産業
第6章 COVID-19の影響評価
- エッジコンピューティング市場に対するCOVID-19の影響度評価
- 地域ごとのCOVID-19の影響分析(四半期)
第7章 ポーターのファイブフォース分析
第8章 マクロ経済指標の見通し
- IoT業界の成長
- IT業界の成長
- スマートシティ開発
- DevOps業界の成長
- 5G採用の需要の急増
第9章 競合ポジショニング - 世界のエッジコンピューティング市場
- 企業 - コンポーネントのポジショニング
- 市場ポジションマトリックス
- 市場シェア分析
- Microsoft Corporation
- SAP SE
- Cisco Systems, Inc.
- Amazon.com, Inc.
- ABB
- Huawei Technologies Co., Ltd.
- Rockwell Automation, Inc.
- Honeywell International Inc.
- General Electric Company
- Hewlett Packard Enterprise
第10章 世界のエッジコンピューティング市場動向と予測分析(2018年~2028年)・CAGR
- マクロ経済要因の影響指数
- 世界のエッジコンピューティング市場:ダッシュボード
- 世界のエッジコンピューティングの市場規模:金額別(2018年~2021年)
- 世界のエッジコンピューティングの市場規模:金額別(2022年~2028年)
- 世界のエッジコンピューティング市場:概要
第11章 世界のエッジコンピューティング市場動向と予測分析(2018年~2028年):コンポーネント別
- 世界のエッジコンピューティング市場動向と予測分析:コンポーネント別、スナップショット
- ハードウェア
- ソフトウェア
- サービス
第12章 世界のエッジコンピューティング市場動向と予測分析(2018年~2028年):アプリケーション別
- 世界のエッジコンピューティング市場動向と予測分析:アプリケーション別、スナップショット
- IIoT
- 遠隔モニタリング
- AR・VR
- コンテンツ配信
- その他
第13章 世界のエッジコンピューティング市場動向と予測分析(2018年~2028年):エンドユーザー別
- 世界のエッジコンピューティング市場動向と予測分析:エンドユーザー別、スナップショット
- BFSI
- 小売・消費者
- 医療・ライフサイエンス
- 工業
- エネルギー・材料
- 通信
- その他
第14章 世界のエッジコンピューティング市場動向と予測分析(2018年~2028年):地域別
- 調査対象地域
第15章 南北アメリカのエッジコンピューティング市場動向と予測分析(2018年~2028年)・CAGR
第16章 欧州のエッジコンピューティング市場動向と予測分析(2018年~2028年)・CAGR
第17章 アジア太平洋地域のエッジコンピューティング市場動向と予測分析(2018年~2028年)・CAGR
第18章 中東・アフリカのエッジコンピューティング市場動向と予測分析(2018年~2028年)・CAGR
List of Figures
List of Figures
- Figure 1: Edge Computing Market for next 7 years (in USD Billions)
- Figure 2: Edge Computing Market Size, By Component, 2018 & 2028 (USD Billion)
- Figure 3: Edge Computing Market Size, Leading Application, 2021 (%)
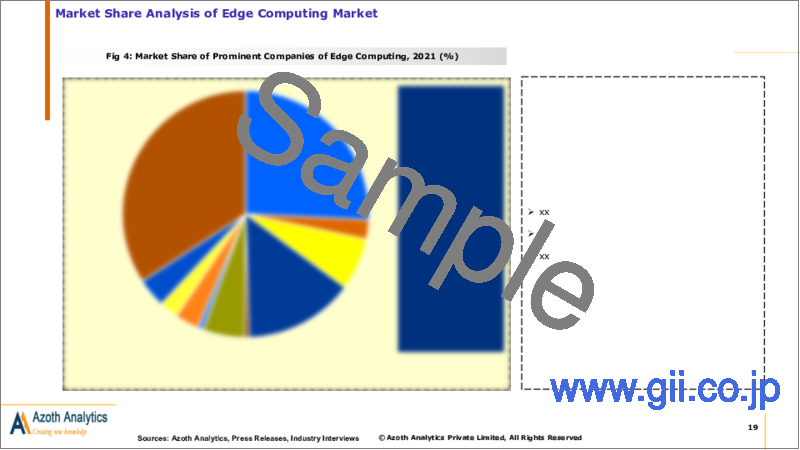
- Figure 4: Market Share of Prominent Companies of Edge Computing, 2021 (%)
- Figure 5: Microsoft Corporation Revenues, 2019-2021 (USD Million)
- Figure 6: Microsoft Corporation Revenue By Business Segment, 2021 (%)
- Figure 7: Microsoft Corporation Revenue By Geographic Segment, 2021 (%)
- Figure 8: SAP SE Revenues, 2019-2021 (USD Million)
- Figure 9: SAP SE, Revenue By Business Segment, 2021 (%)
- Figure 10: SAP SE, Revenue By Geographic Segment, 2021 (%)
- Figure 11: Cisco Systems, Inc. Revenues, 2019-2021 (USD Million)
- Figure 12: Cisco Systems, Inc. Revenue By Business Segment, 2021 (%)
- Figure 13: Cisco Systems, Inc. Revenue By Geographic Segment, 2021 (%)
- Figure 14: Amazon.com, Inc. Revenues, 2019-2021 (USD Million)
- Figure 15: Amazon.com, Inc. Revenue By Business Segment, 2021 (%)
- Figure 16: Amazon.com, Inc. Revenue By Geographic Segment, 2021 (%)
- Figure 17: ABB Revenues, 2019-2021 (USD Million)
- Figure 18: ABB Revenue By Business Segment, 2021 (%)
- Figure 19: ABB Revenue By Geographic Segment, 2021 (%)
- Figure 20: Huawei Technologies Co., Ltd. Revenues, 2019-2021 (USD Million)
- Figure 21: Huawei Technologies Co., Ltd. Revenue By Business Segment, 2021 (%)
- Figure 22: Huawei Technologies Co., Ltd. Revenue By Geographic Segment, 2021 (%)
- Figure 23: Rockwell Automation, Inc. Revenues, 2019-2021 (USD Million)
- Figure 24: Rockwell Automation, Inc. Revenue By Business Segment, 2021 (%)
- Figure 25: Rockwell Automation, Inc. Revenue By Geographic Segment, 2021 (%)
- Figure 26: Honeywell International Inc. Revenues, 2019-2021 (USD Million)
- Figure 27: Honeywell International Inc. Revenue By Business Segment, 2021 (%)
- Figure 28: Honeywell International Inc. Revenue By Geographic Segment, 2021 (%)
- Figure 29: General Electric Company Revenues, 2019-2021 (USD Million)
- Figure 30: General Electric Company Revenue By Business Segment, 2021 (%)
- Figure 31: General Electric Company Revenue By Geographic Segment, 2021 (%)
- Figure 32: Hewlett Packard Enterprise Revenues, 2019-2021 (USD Million)
- Figure 33: Hewlett Packard Enterprise Revenue By Business Segment, 2021 (%)
- Figure 34: Hewlett Packard Enterprise Revenue By Geographic Segment, 2021 (%)
- Figure 35: At a CAGR of 136.86% during 2023-2028, the global market value is expected to reach USD 198.09 Billion in 2028
- Figure 36: Sales of Hardware is expected to contribute a share of 48.44% in 2021
- Figure 37: Basis Point Analysis of Global Edge Computing Market, By Region (2022, 2028)
- Figure 38: Market Opportunity Analysis of Global Edge Computing Market, By Region (2023-2028)
- Figure 39: Global Edge Computing Market Size, By Value, 2018-2021 (USD Billion)
- Figure 40: Global Edge Computing Market Size, By Value, 2022-2028 (USD Billion)
- Figure 41: Global Edge Computing Market Share, By Component, 2021 (%)
- Figure 42: Global Edge Computing Market CAGR, By Component, By Value, 2018-2021, 2023-2028 (%)
- Figure 43: Basis Point Analysis of Global Edge Computing Market, By Component (2022, 2028)
- Figure 44: Market Opportunity Analysis of Global Edge Computing Market, By Component (2023-2028)
- Figure 45: Global Edge Computing Market Size, By Component, Hardware, By Value, 2018-2021 (USD Billion)
- Figure 46: Global Edge Computing Market Size, By Component, Hardware, By Value, 2022-2028 (USD Billion)
- Figure 47: Global Edge Computing Market Absolute Opportunity, By Component, Hardware, 2018-2028 (USD Billion)
- Figure 48: Global Edge Computing Market Size, By Component, Software, By Value, 2018-2021 (USD Billion)
- Figure 49: Global Edge Computing Market Size, By Component, Software, By Value, 2022-2028 (USD Billion)
- Figure 50: Global Edge Computing Market Absolute Opportunity, By Component, Software, 2018-2028 (USD Billion)
- Figure 51: Global Edge Computing Market Size, By Component, Service, By Value, 2018-2021 (USD Billion)
- Figure 52: Global Edge Computing Market Size, By Component, Service, By Value, 2022-2028 (USD Billion)
- Figure 53: Global Edge Computing Market Absolute Opportunity, By Component, Service, 2018-2028 (USD Billion)
- Figure 54: Global Application Market CAGR, By Value, 2018-2021, 2023-2028 (%)
- Figure 55: Basis Point Analysis of Global Edge Computing Market, By Application (2022, 2028)
- Figure 56: Market Opportunity Analysis of Global Edge Computing Market, By Application (2023-2028)
- Figure 57: Global Edge Computing Market Size, By Application, IIOT, By Value, 2018-2021 (USD Billion)
- Figure 58: Global Edge Computing Market Size, By Application, IIOT, By Value, 2022-2028 (USD Billion)
- Figure 59: Global Edge Computing Market Absolute Opportunity, By Application, IIOT, 2018-2028 (USD Billion)
- Figure 60: Global Edge Computing Market Size, By Application, Remote Monitoring, By Value, 2018-2021 (USD Billion)
- Figure 61: Global Edge Computing Market Size, By Application, Remote Monitoring, By Value, 2022-2028 (USD Billion)
- Figure 62: Global Edge Computing Market Absolute Opportunity, By Application, Remote Monitoring, 2018-2028 (USD Billion)
- Figure 63: Global Edge Computing Market Size, By Application, AR and VR, By Value, 2018-2021 (USD Billion)
- Figure 64: Global Edge Computing Market Size, By Application, AR and VR, By Value, 2022-2028 (USD Billion)
- Figure 65: Global Edge Computing Market Absolute Opportunity, By Application, AR and VR, 2018-2028 (USD Billion)
- Figure 66: Global Edge Computing Market Size, By Application, Content Delivery, By Value, 2018-2021 (USD Billion)
- Figure 67: Global Edge Computing Market Size, By Application, Content Delivery, By Value, 2022-2028 (USD Billion)
- Figure 68: Global Edge Computing Market Absolute Opportunity, By Application, Content Delivery, 2018-2028 (USD Billion)
- Figure 69: Global Edge Computing Market Size, By Application, Others, By Value, 2018-2021 (USD Billion)
- Figure 70: Global Edge Computing Market Size, By Application, Others, By Value, 2022-2028 (USD Billion)
- Figure 71: Global Edge Computing Market Absolute Opportunity, By Application, Others, 2018-2028 (USD Billion)
- Figure 72: Global End-User Market CAGR, By Value, 2018-2021, 2023-2028 (%)
- Figure 73: Basis Point Analysis of Global Edge Computing Market, By End-User (2022, 2028)
- Figure 74: Market Opportunity Analysis of Global Edge Computing Market, By End-User (2023-2028)
- Figure 75: Global Edge Computing Market Size, By End-User, BFSI, By Value, 2018-2021 (USD Billion)
- Figure 76: Global Edge Computing Market Size, By End-User, BFSI, By Value, 2022-2028 (USD Billion)
- Figure 77: Global Edge Computing Market Absolute Opportunity, By End-User, BFSI, 2018-2028 (USD Billion)
- Figure 78: Global Edge Computing Market Size, By End-User, Retail & Consumer, By Value, 2018-2021 (USD Billion)
- Figure 79: Global Edge Computing Market Size, By End-User, Retail & Consumer, By Value, 2022-2028 (USD Billion)
- Figure 80: Global Edge Computing Market Absolute Opportunity, By End-User, Retail & Consumer, 2018-2028 (USD Billion)
- Figure 81: Global Edge Computing Market Size, By End-User, Healthcare and Life Sciences, By Value, 2018-2021 (USD Billion)
- Figure 82: Global Edge Computing Market Size, By End-User, Healthcare and Life Sciences, By Value, 2022-2028 (USD Billion)
- Figure 83: Global Edge Computing Market Absolute Opportunity, By End-User, Healthcare and Life Sciences, 2018-2028 (USD Billion)
- Figure 84: Global Edge Computing Market Size, By End-User, Industrial, By Value, 2018-2021 (USD Billion)
- Figure 85: Global Edge Computing Market Size, By End-User, Industrial, By Value, 2022-2028 (USD Billion)
- Figure 86: Global Edge Computing Market Absolute Opportunity, By End-User, Industrial, 2018-2028 (USD Billion)
- Figure 87: Global Edge Computing Market Size, By End-User, Energy and Materials, By Value, 2018-2021 (USD Billion)
- Figure 88: Global Edge Computing Market Size, By End-User, Energy and Materials, By Value, 2022-2028 (USD Billion)
- Figure 89: Global Edge Computing Market Absolute Opportunity, By End-User, Energy and Materials, 2018-2028 (USD Billion)
- Figure 90: Global Edge Computing Market Size, By End-User, Telecommunications, By Value, 2018-2021 (USD Billion)
- Figure 91: Global Edge Computing Market Size, By End-User, Telecommunications, By Value, 2022-2028 (USD Billion)
- Figure 92: Global Edge Computing Market Absolute Opportunity, By End-User, Telecommunications, 2018-2028 (USD Billion)
- Figure 93: Global Edge Computing Market Size, By End-User, Others, By Value, 2018-2021 (USD Billion)
- Figure 94: Global Edge Computing Market Size, By End-User, Others, By Value, 2022-2028 (USD Billion)
- Figure 95: Global Edge Computing Market Absolute Opportunity, By End-User, Others, 2018-2028 (USD Billion)
- Figure 96: Market Value of the Americas is expected to grow from USD 7.09 BN in 2021 to USD 54.08 Million in 2028
- Figure 97: Americas Edge Computing Market is expected to foresee an absolute growth rate of 34.33% during 2023-2028
- Figure 98: Market Value by Leading Component
- Figure 99: Market Value by Leading Application
- Figure 100: Top 3 End-User of Edge Computing
- Figure 101: Basis Point Analysis of Americas Edge Computing Market, By Country (2022, 2028)
- Figure 102: Market Opportunity Analysis of Americas Edge Computing Market, By Country (2023-2028)
- Figure 103: Americas Edge Computing Market Size, By Value, 2018-2021 (USD Billion)
- Figure 104: Americas Edge Computing Market Size, By Value, 2022-2028 (USD Billion)
- Figure 105: Americas Edge Computing Market Share, By End-User, 2021 (%)
- Figure 106: Americas Component Market CAGR, By Value, 2018-2021, 2023-2028 (%)
- Figure 107: Basis Point Analysis of Americas Edge Computing Market, By Component (2022, 2028)
- Figure 108: Market Opportunity Analysis of Americas Edge Computing Market, By Component (2023-2028)
- Figure 109: Americas Edge Computing Market Size, By Component, Hardware, By Value, 2018-2021 (USD Billion)
- Figure 110: Americas Edge Computing Market Size, By Component, Hardware, By Value, 2022-2028 (USD Billion)
- Figure 111: Americas Component Hardware Footprint in Global Market, 2021 (% of Global Market)
- Figure 112: Americas Edge Computing Market Size, By Component, Software, By Value, 2018-2021 (USD Billion)
- Figure 113: Americas Edge Computing Market Size, By Component, Software, By Value, 2022-2028 (USD Billion)
- Figure 114: Americas Component Software Footprint in Global Market, 2021 (% of Global Market)
- Figure 115: Americas Edge Computing Market Size, By Component, Service, By Value, 2018-2021 (USD Billion)
- Figure 116: Americas Edge Computing Market Size, By Component, Service, By Value, 2022-2028 (USD Billion)
- Figure 117: Americas Component Service Footprint in Global Market, 2021 (% of Global Market)
- Figure 118: Americas Application Market CAGR, By Value, 2018-2021, 2023-2028 (%)
- Figure 119: Basis Point Analysis of Americas Market, By Application (2022, 2028)
- Figure 120: Market Opportunity Analysis of Americas, By Application (2023-2028)
- Figure 121: Americas Edge Computing Market Size, By Application, IIOT, By Value, 2018-2021 (USD Billion)
- Figure 122: Americas Edge Computing Market Size, By Application, IIOT, By Value, 2022-2028 (USD Billion)
- Figure 123: Americas Application IIOT Footprint in Global Market, 2021 (% of Global Market)
- Figure 124: Americas Edge Computing Market Size, By Application, Remote Monitoring, By Value, 2018-2021 (USD Billion)
- Figure 125: Americas Edge Computing Market Size, By Application, Remote Monitoring, By Value, 2022-2028 (USD Billion)
- Figure 126: Americas Application Remote Monitoring Footprint in Global Market, 2021 (% of Global Market)
- Figure 127: Americas Edge Computing Market Size, By Application, AR and VR, By Value, 2018-2021 (USD Billion)
- Figure 128: Americas Edge Computing Market Size, By Application, AR and VR, By Value, 2022-2028 (USD Billion)
- Figure 129: Americas Application AR and VR Footprint in Global Market, 2021 (% of Global Market)
- Figure 130: Americas Edge Computing Market Size, By Application, Content Delivery, By Value, 2018-2021 (USD Billion)
- Figure 131: Americas Edge Computing Market Size, By Application, Content Delivery, By Value, 2022-2028 (USD Billion)
- Figure 132: Americas Application Content Delivery Footprint in Global Market, 2021 (% of Global Market)
- Figure 133: Americas Edge Computing Market Size, By Application, Others, By Value, 2018-2021 (USD Billion)
- Figure 134: Americas Edge Computing Market Size, By Application, Others, By Value, 2022-2028 (USD Billion)
- Figure 135: Americas Application Others Footprint in Global Market, 2021 (% of Global Market)
- Figure 136: Americas End-User Market CAGR, By Value, 2018-2021, 2023-2028 (%)
- Figure 137: Basis Point Analysis of Americas Edge Computing Market, By End-User (2022, 2028)
- Figure 138: Market Opportunity Analysis of Americas Edge Computing Market, By End-User (2023-2028)
- Figure 139: Americas Edge Computing Market Size, By End-User, BFSI, By Value, 2018-2021 (USD Billion)
- Figure 140: Americas Edge Computing Market Size, By End-User, BFSI, By Value, 2022-2028 (USD Billion)
- Figure 141: Americas End-User BFSI Footprint in Global Market, 2021 (% of Global Market)
- Figure 142: Americas Edge Computing Market Size, By End-User, Retail and Consumer, By Value, 2018-2021 (USD Billion)
- Figure 143: Americas Edge Computing Market Size, By End-User, Retail and Consumer, By Value, By Value, 2022-2028 (USD Billion)
- Figure 144: Americas End-User Retail and Consumer Footprint in Global Market, 2021 (% of Global Market)
- Figure 145: Americas Edge Computing Market Size, By End-User, Healthcare and Life Sciences, By Value, 2018-2021 (USD Billion)
- Figure 146: Americas Edge Computing Market Size, By End-User, Healthcare and Life Sciences, By Value, 2022-2028 (USD Billion)
- Figure 147: Americas End-User Healthcare and Life Sciences Footprint in Global Market, 2021 (% of Global Market)
- Figure 148: Americas Edge Computing Market Size, By End-User, Industrial, By Value, 2018-2021 (USD Billion)
- Figure 149: Americas Edge Computing Market Size, By End-User, Industrial, By Value, 2022-2028 (USD Billion)
- Figure 150: Americas End-User Industrial Footprint in Global Market, 2021 (% of Global Market)
- Figure 151: Americas Edge Computing Market Size, By End-User, Energy and Materials, By Value, 2018-2021 (USD Billion)
- Figure 152: Americas Edge Computing Market Size, By End-User, Energy and Materials, By Value, 2022-2028 (USD Billion)
- Figure 153: Americas End-User Energy and Materials Footprint in Global Market, 2021 (% of Global Market)
- Figure 154: Americas Edge Computing Market Size, By End-User, Telecommunications, By Value, 2018-2021 (USD Billion)
- Figure 155: Americas Edge Computing Market Size, By End-User, Telecommunications, By Value, 2022-2028 (USD Billion)
- Figure 156: Americas End-User Telecommunications Footprint in Global Market, 2021 (% of Global Market)
- Figure 157: Americas Edge Computing Market Size, By End-User, Others, By Value, 2018-2021 (USD Billion)
- Figure 158: Americas Edge Computing Market Size, By End-User, Others, By Value, 2022-2028 (USD Billion)
- Figure 159: Americas End-User Others Footprint in Global Market, 2021 (% of Global Market)
- Figure 160: United States Edge Computing Market, By Value, 2018-2028 (USD Billion)
- Figure 161: United States Edge Computing Market, CAGR, By Value, 2018-2021, 2023-2028 (%)
- Figure 162: United States Edge Computing Market Value, By Component, 2021 (USD Billion)
- Figure 163: United States Edge Computing Market Share, By Component, By Value, 2021 (%)
- Figure 164: United States Edge Computing Market Share, By Application, By Value, 2021 (%)
- Figure 165: United States Edge Computing Market Share, By End-User, By Value, 2021 (%)
- Figure 166: Canada Edge Computing Market, By Value, 2018-2028 (USD Billion)
- Figure 167: Canada Edge Computing Market, CAGR, By Value, 2018-2021, 2023-2028 (%)
- Figure 168: Canada Edge Computing Market Value, By Component, 2021 (USD Billion)
- Figure 169: Canada Edge Computing Market Share, By Component, By Value, 2021 (%)
- Figure 170: Canada Edge Computing Market Share, By Application, By Value, 2021 (%)
- Figure 171: Canada Edge Computing Market Share, By End-User, By Value, 2021 (%)
- Figure 172: Mexico Edge Computing Market, By Value, 2018-2028 (USD Billion)
- Figure 173: Mexico Edge Computing Market, CAGR, By Value, 2018-2021, 2023-2028 (%)
- Figure 174: Mexico Edge Computing Market Value, By Component, 2021 (USD Billion)
- Figure 175: Mexico Edge Computing Market Share, By Component, By Value, 2021 (%)
- Figure 176: Mexico Edge Computing Market Share, By Application, By Value, 2021 (%)
- Figure 177: Mexico Edge Computing Market Share, By End-User, By Value, 2021 (%)
- Figure 178: Brazil Edge Computing Market, By Value, 2018-2028 (USD Billion)
- Figure 179: Brazil Edge Computing Market, CAGR, By Value, 2018-2021, 2023-2028 (%)
- Figure 180: Brazil Edge Computing Market Value, By Component, 2021 (USD Billion)
- Figure 181: Brazil Edge Computing Market Share, By Component, By Value, 2021 (%)
- Figure 182: Brazil Edge Computing Market Share, By Application, By Value, 2021 (%)
- Figure 183: Brazil Edge Computing Market Share, By End-User, By Value, 2021 (%)
- Figure 184: Rest of Americas Edge Computing Market, By Value, 2018-2028 (USD Billion)
- Figure 185: Rest of Americas Edge Computing Market, CAGR, By Value, 2018-2021, 2023-2028 (%)
- Figure 186: Rest of Americas Edge Computing Market Value, By Component, 2021 (USD Billion)
- Figure 187: Rest of Americas Edge Computing Market Share, By Component, By Value, 2021 (%)
- Figure 188: Rest of Americas Edge Computing Market Share, By Application, By Value, 2021 (%)
- Figure 189: Rest of Americas Edge Computing Market Share, By End-User, By Value, 2021 (%)
- Figure 190: Market Value of the Europe is expected to grow from USD 6.13 BN in 2021 to USD 55.56 BN in 2028
- Figure 191: Europe Edge Computing Market is expected to foresee an absolute growth of 37.71 % during 2023-2028
- Figure 192: Market Value by Leading Component
- Figure 193: Market Value by Leading Application
- Figure 194: Top 3 End-User of Edge Computing
- Figure 195: Basis Point Analysis of Europe Edge Computing Market, By Country (2022, 2028)
- Figure 196: Market Opportunity Analysis of Europe Edge Computing Market, By Country (2023-2028)
- Figure 197: Europe Edge Computing Market Size, By Value, 2018-2021 (USD Billion)
- Figure 198: Europe Edge Computing Market Size, By Value, 2022-2028 (USD Billion)
- Figure 199: Europe Edge Computing Market Share, By End-User, 2021 (%)
- Figure 200: Europe Component Market CAGR, By Value, 2018-2021, 2023-2028 (%)
- Figure 201: Basis Point Analysis of Europe Edge Computing Market, By Component (2022, 2028)
- Figure 202: Market Opportunity Analysis of Europe Edge Computing Market, By Component (2023-2028)
- Figure 203: Europe Edge Computing Market Size, By Component, Hardware, By Value, 2018-2021 (USD Billion)
- Figure 204: Europe Edge Computing Market Size, By Component, Hardware, By Value, 2022-2028 (USD Billion)
- Figure 205: Europe Component Hardware Footprint in Global Market, 2021 (% of Global Market)
- Figure 206: Europe Edge Computing Market Size, By Component, Software, By Value, 2018-2021 (USD Billion)
- Figure 207: Europe Edge Computing Market Size, By Component, Software, By Value, 2022-2028 (USD Billion)
- Figure 208: Europe Component Software Footprint in Global Market, 2021 (% of Global Market)
- Figure 209: Europe Edge Computing Market Size, By Component, Service, By Value, 2018-2021 (USD Billion)
- Figure 210: Europe Edge Computing Market Size, By Component, Service, By Value, 2022-2028 (USD Billion)
- Figure 211: Europe Component Service Footprint in Global Market, 2021 (% of Global Market)
- Figure 212: Europe Application Market CAGR, By Value, 2018-2021, 2023-2028 (%)
- Figure 213: Basis Point Analysis of Europe Market, By Application (2022, 2028)
- Figure 214: Market Opportunity Analysis of Europe, By Application (2023-2028)
- Figure 215: Europe Edge Computing Market Size, By Application, IIOT, By Value, 2018-2021 (USD Billion)
- Figure 216: Europe Edge Computing Market Size, By Application, IIOT, By Value, 2022-2028 (USD Billion)
- Figure 217: Europe Application IIOT Footprint in Global Market, 2021 (% of Global Market)
- Figure 218: Europe Edge Computing Market Size, By Application, Remote Monitoring, By Value, 2018-2021 (USD Billion)
- Figure 219: Europe Edge Computing Market Size, By Application, Remote Monitoring, By Value, 2022-2028 (USD Billion)
- Figure 220: Europe Application Remote Monitoring Footprint in Global Market, 2021 (% of Global Market)
- Figure 221: Europe Edge Computing Market Size, By Application, AR and VR, By Value, 2018-2021 (USD Billion)
- Figure 222: Europe Edge Computing Market Size, By Application, AR and VR, By Value, 2022-2028 (USD Billion)
- Figure 223: Europe Application AR and VR Footprint in Global Market, 2021 (% of Global Market)
- Figure 224: Europe Edge Computing Market Size, By Application, Content Delivery, By Value, 2018-2021 (USD Billion)
- Figure 225: Europe Edge Computing Market Size, By Application, Content Delivery, By Value, 2022-2028 (USD Billion)
- Figure 226: Europe Application Content Delivery Footprint in Global Market, 2021 (% of Global Market)
- Figure 227: Europe Edge Computing Market Size, By Application, Others, By Value, 2018-2021 (USD Billion)
- Figure 228: Europe Edge Computing Market Size, By Application, Others, By Value, 2022-2028 (USD Billion)
- Figure 229: Europe Application Others Footprint in Global Market, 2021 (% of Global Market)
- Figure 230: Europe End-User Market CAGR, By Value, 2018-2021, 2023-2028 (%)
- Figure 231: Basis Point Analysis of Europe Edge Computing Market, By End-User (2022, 2028)
- Figure 232: Market Opportunity Analysis of Europe Edge Computing Market, By End-User (2023-2028)
- Figure 233: Europe Edge Computing Market Size, By End-User, BFSI, By Value, 2018-2021 (USD Billion)
- Figure 234: Europe Edge Computing Market Size, By End-User, BFSI, By Value, 2022-2028 (USD Billion)
- Figure 235: Europe End-User BFSI Footprint in Global Market, 2021 (% of Global Market)
- Figure 236: Europe Edge Computing Market Size, By End-User, Retail and Consumer, By Value, 2018-2021 (USD Billion)
- Figure 237: Europe Edge Computing Market Size, By End-User, Retail and Consumer, By Value, By Value, 2022-2028 (USD Billion)
- Figure 238: Europe End-User Retail and Consumer Footprint in Global Market, 2021 (% of Global Market)
- Figure 239: Europe Edge Computing Market Size, By End-User, Healthcare and Life Sciences, By Value, 2018-2021 (USD Billion)
- Figure 240: Europe Edge Computing Market Size, By End-User, Healthcare and Life Sciences, By Value, 2022-2028 (USD Billion)
- Figure 241: Europe End-User Healthcare and Life Sciences Footprint in Global Market, 2021 (% of Global Market)
- Figure 242: Europe Edge Computing Market Size, By End-User, Industrial, By Value, 2018-2021 (USD Billion)
- Figure 243: Europe Edge Computing Market Size, By End-User, Industrial, By Value, 2022-2028 (USD Billion)
- Figure 244: Europe End-User Industrial Footprint in Global Market, 2021 (% of Global Market)
- Figure 245: Europe Edge Computing Market Size, By End-User, Energy and Materials, By Value, 2018-2021 (USD Billion)
- Figure 246: Europe Edge Computing Market Size, By End-User, Energy and Materials, By Value, 2022-2028 (USD Billion)
- Figure 247: Europe End-User Energy and Materials Footprint in Global Market, 2021 (% of Global Market)
- Figure 248: Europe Edge Computing Market Size, By End-User, Telecommunications, By Value, 2018-2021 (USD Billion)
- Figure 249: Europe Edge Computing Market Size, By End-User, Telecommunications, By Value, 2022-2028 (USD Billion)
- Figure 250: Europe End-User Telecommunications Footprint in Global Market, 2021 (% of Global Market)
- Figure 251: Europe Edge Computing Market Size, By End-User, Others, By Value, 2018-2021 (USD Billion)
- Figure 252: Europe Edge Computing Market Size, By End-User, Others, By Value, 2022-2028 (USD Billion)
- Figure 253: Europe End-User Others Footprint in Global Market, 2021 (% of Global Market)
- Figure 254: Germany Edge Computing Market, By Value, 2018-2028 (USD Billion)
- Figure 255: Germany Edge Computing Market, CAGR, By Value, 2018-2021, 2023-2028 (%)
- Figure 256: Germany Edge Computing Market Value, By Component, 2021 (USD Billion)
- Figure 257: Germany Edge Computing Market Share, By Component, By Value, 2021 (%)
- Figure 258: Germany Edge Computing Market Share, By Application, By Value, 2021 (%)
- Figure 259: Germany Edge Computing Market Share, By End-User, By Value, 2021 (%)
- Figure 260: United Kingdom Edge Computing Market, By Value, 2018-2028 (USD Billion)
- Figure 261: United Kingdom Edge Computing Market, CAGR, By Value, 2018-2021, 2023-2028 (%)
- Figure 262: United Kingdom Edge Computing Market Value, By Component, 2021 (USD Billion)
- Figure 263: United Kingdom Edge Computing Market Share, By Component, By Value, 2021 (%)
- Figure 264: United Kingdom Edge Computing Market Share, By Application, By Value, 2021 (%)
- Figure 265: United Kingdom Edge Computing Market Share, By End-User, By Value, 2021 (%)
- Figure 266: France Edge Computing Market, By Value, 2018-2028 (USD Billion)
- Figure 267: France Edge Computing Market, CAGR, By Value, 2018-2021, 2023-2028 (%)
- Figure 268: France Edge Computing Market Value, By Component, 2021 (USD Billion)
- Figure 269: France Edge Computing Market Share, By Component, By Value, 2021 (%)
- Figure 270: France Edge Computing Market Share, By Application, By Value, 2021 (%)
- Figure 271: France Edge Computing Market Share, By End-User, By Value, 2021 (%)
- Figure 272: Rest of Europe Edge Computing Market, By Value, 2018-2028 (USD Billion)
- Figure 273: Rest of Europe Edge Computing Market, CAGR, By Value, 2018-2021, 2023-2028 (%)
- Figure 274: Rest of Europe Edge Computing Market Value, By Component Type, 2021 (USD Billion)
- Figure 275: Rest of Europe Edge Computing Market Share, By Component, By Value, 2021 (%)
- Figure 276: Rest of Europe Edge Computing Market Share, By Application, By Value, 2021 (%)
- Figure 277: Rest of Europe Edge Computing Market Share, By End-User, By Value, 2021 (%)
- Figure 278: Market Value of the Asia Pacific is expected to grow from USD 8.40 BN in 2021 to USD 79.83 BN in 2028
- Figure 279: Asia Pacific Edge Computing Market is expected to foresee an absolute growth of 38.65% during 2023-2028
- Figure 280: Market Value by Leading Component
- Figure 281: Market Value by Leading Application
- Figure 282: Top 3 End-User of Edge Computing
- Figure 283: Basis Point Analysis of Asia Pacific Edge Computing Market, By Country (2022, 2028)
- Figure 284: Market Opportunity Analysis of Asia Pacific Edge Computing Market, By Country (2023-2028)
- Figure 285: Asia Pacific Edge Computing Market Size, By Value, 2018-2021 (USD Billion)
- Figure 286: Asia Pacific Edge Computing Market Size, By Value, 2022-2028 (USD Billion)
- Figure 287: Asia Pacific Edge Computing Market Share, By End-User, 2021 (%)
- Figure 288: Asia Pacific Component Market CAGR, By Value, 2018-2021, 2023-2028 (%)
- Figure 289: Basis Point Analysis of Asia Pacific Edge Computing Market, By Component (2022, 2028)
- Figure 290: Market Opportunity Analysis of Asia Pacific Edge Computing Market, By Component (2023-2028)
- Figure 291: Asia Pacific Edge Computing Market Size, By Component, Hardware, By Value, 2018-2021 (USD Billion)
- Figure 292: Asia Pacific Edge Computing Market Size, By Component, Hardware, By Value, 2022-2028 (USD Billion)
- Figure 293: Asia Pacific Component Hardware Footprint in Global Market, 2021 (% of Global Market)
- Figure 294: Asia Pacific Edge Computing Market Size, By Component, Software, By Value, 2018-2021 (USD Billion)
- Figure 295: Asia Pacific Edge Computing Market Size, By Component, Software, By Value, 2022-2028 (USD Billion)
- Figure 296: Asia Pacific Component Software Footprint in Global Market, 2021 (% of Global Market)
- Figure 297: Asia Pacific Edge Computing Market Size, By Component, Service, By Value, 2018-2021 (USD Billion)
- Figure 298: Asia Pacific Edge Computing Market Size, By Component, Service, By Value, 2022-2028 (USD Billion)
- Figure 299: Asia Pacific Component Service Footprint in Global Market, 2021 (% of Global Market)
- Figure 300: Asia Pacific Application Market CAGR, By Value, 2018-2021, 2023-2028 (%)
- Figure 301: Basis Point Analysis of Asia Pacific Market, By Application (2022, 2028)
- Figure 302: Market Opportunity Analysis of Asia Pacific, By Application (2023-2028)
- Figure 303: Asia Pacific Edge Computing Market Size, By Application, IIOT, By Value, 2018-2021 (USD Billion)
- Figure 304: Asia Pacific Edge Computing Market Size, By Application, IIOT, By Value, 2022-2028 (USD Billion)
- Figure 305: Asia Pacific Application IIOT Footprint in Global Market, 2021 (% of Global Market)
- Figure 306: Asia Pacific Edge Computing Market Size, By Application, Remote Monitoring, By Value, 2018-2021 (USD Billion)
- Figure 307: Asia Pacific Edge Computing Market Size, By Application, Remote Monitoring, By Value, 2022-2028 (USD Billion)
- Figure 308: Asia Pacific Application Remote Monitoring Footprint in Global Market, 2021 (% of Global Market)
- Figure 309: Asia Pacific Edge Computing Market Size, By Application, AR and VR, By Value, 2018-2021 (USD Billion)
- Figure 310: Asia Pacific Edge Computing Market Size, By Application, AR and VR, By Value, 2022-2028 (USD Billion)
- Figure 311: Asia Pacific Application AR and VR Footprint in Global Market, 2021 (% of Global Market)
- Figure 312: Asia Pacific Edge Computing Market Size, By Application, Content Delivery, By Value, 2018-2021 (USD Billion)
- Figure 313: Asia Pacific Edge Computing Market Size, By Application, Content Delivery, By Value, 2022-2028 (USD Billion)
- Figure 314: Asia Pacific Application Content Delivery Footprint in Global Market, 2021 (% of Global Market)
- Figure 315: Asia Pacific Edge Computing Market Size, By Application, Others, By Value, 2018-2021 (USD Billion)
- Figure 316: Asia Pacific Edge Computing Market Size, By Application, Others, By Value, 2022-2028 (USD Billion)
- Figure 317: Asia Pacific Application Others Footprint in Global Market, 2021 (% of Global Market)
- Figure 318: Asia Pacific End-User Market CAGR, By Value, 2018-2021, 2023-2028 (%)
- Figure 319: Basis Point Analysis of Asia Pacific Edge Computing Market, By End-User (2022, 2028)
- Figure 320: Market Opportunity Analysis of Asia Pacific Edge Computing Market, By End-User (2023-2028)
- Figure 321: Asia Pacific Edge Computing Market Size, By End-User, BFSI, By Value, 2018-2021 (USD Billion)
- Figure 322: Asia Pacific Edge Computing Market Size, By End-User, BFSI, By Value, 2022-2028 (USD Billion)
- Figure 323: Asia Pacific End-User BFSI Footprint in Global Market, 2021 (% of Global Market)
- Figure 324: Asia Pacific Edge Computing Market Size, By End-User, Retail and Consumer, By Value, 2018-2021 (USD Billion)
- Figure 325: Asia Pacific Edge Computing Market Size, By End-User, Retail and Consumer, By Value, By Value, 2022-2028 (USD Billion)
- Figure 326: Asia Pacific End-User Retail and Consumer Footprint in Global Market, 2021 (% of Global Market)
- Figure 327: Asia Pacific Edge Computing Market Size, By End-User, Healthcare and Life Sciences, By Value, 2018-2021 (USD Billion)
- Figure 328: Asia Pacific Edge Computing Market Size, By End-User, Healthcare and Life Sciences, By Value, 2022-2028 (USD Billion)
- Figure 329: Asia Pacific End-User Healthcare and Life Sciences Footprint in Global Market, 2021 (% of Global Market)
- Figure 330: Asia Pacific Edge Computing Market Size, By End-User, Industrial, By Value, 2018-2021 (USD Billion)
- Figure 331: Asia Pacific Edge Computing Market Size, By End-User, Industrial, By Value, 2022-2028 (USD Billion)
- Figure 332: Asia Pacific End-User Industrial Footprint in Global Market, 2021 (% of Global Market)
- Figure 333: Asia Pacific Edge Computing Market Size, By End-User, Energy and Materials, By Value, 2018-2021 (USD Billion)
- Figure 334: Asia Pacific Edge Computing Market Size, By End-User, Energy and Materials, By Value, 2022-2028 (USD Billion)
- Figure 335: Asia Pacific End-User Energy and Materials Footprint in Global Market, 2021 (% of Global Market)
- Figure 336: Asia Pacific Edge Computing Market Size, By End-User, Telecommunications, By Value, 2018-2021 (USD Billion)
- Figure 337: Asia Pacific Edge Computing Market Size, By End-User, Telecommunications, By Value, 2022-2028 (USD Billion)
- Figure 338: Asia Pacific End-User Telecommunications Footprint in Global Market, 2021 (% of Global Market)
- Figure 339: Asia Pacific Edge Computing Market Size, By End-User, Others, By Value, 2018-2021 (USD B
Executive Summary
According to a research report published by Azoth Analytics in December 2022, the Global Edge Computing Market was valued at USD 22.85 Billion in the year 2021. The edge computing market is highly dynamic, fueled by a growing range of use cases with key service requirements, such as low latency performance, reduced bandwidth demands, and data security and sovereignty. Edge computing brings processing capabilities closer to the end user. Demand for new applications means the time is ripe for edge - consumers want low latency for real-time experiences and enterprises require local processing for secure and resilient operations.
The market expansion can be attributed to the development of technology, the rise in enterprise clients, large-scale investments, the expansion of BYOD usage in recent workplaces, and rising latency connectivity need. Companies around the world use key strategies such as Component launches, business expansions, mergers and acquisitions, patents and approvals, agreements and collaborations.
In terms of applications, the IIOT (Industrial Internet of Things) segment dominated the edge computing industry. Industrial Businesses have adopted edge computing at a quicker rate in order to improve IOT device interoperability, lower unexpected downtime challenges and enhance production efficiency.
The quick processing power of edge devices will drive everything, including remote work and commutes to the workplace. Edge computing and 5G are opening a world of new revenue opportunities across manufacturing, transport, gaming and more.
Scope of the Report
- The report presents the analysis of the Edge Computing market for the historical period of 2018-2021, the estimated year 2022 and the forecast period of 2023-2028.
- The report analyses the Edge Computing Market by Value (USD Billion).
- The report analyses the Edge Computing Market by Component (Hardware, Software, Service)
- The report analyses the Edge Computing Market by Application (IIOT, Remote Monitoring, AR and VR, Content Delivery, Others (Video Analytics, Autonomous - in Vehicles, Drones, Gaming)
- The report analyses the Edge Computing Market by End-User (BFSI, Retail & Consumer, Healthcare and Life Sciences, Industrial, Energy and Materials, Telecommunications, Others (Agriculture, Transportation & Logistics, Datacenters, Smart Cities, Smart Homes, Smart Buildings))
- The Global Edge Computing Market has been analysed by countries (United States, Canada, Mexico, Brazil, Germany, United Kingdom, France, China, Japan, South Korea)
- The attractiveness of the market has been presented by region, by Component, Application and End-User.
- Also, the major opportunities, trends, drivers and challenges of the industry has been analysed in the report.
- The report tracks competitive developments, strategies, mergers and acquisitions and new product development. The companies analysed in the report include - Microsoft Corporation, SAP SE, Cisco Systems, Inc., Amazon.com, Inc., ABB, Huawei Technologies Co., Ltd., Rockwell Automation, Inc., Honeywell International Inc., General Electric Company, Hewlett Packard Enterprise.
Key Target Audience
- Software Industry
- Consulting and Advisory Firms
- Government and Policy Makers
- Regulatory Authorities
Table of Contents
1. Introduction
- 1.1 Edge Computing Overview
- 1.2 Scope of Research
2. Executive Summary
- 2.1 Market Dashboard
- 2.2 Regional Insights
- 2.3 Market Ecosystem Factors
3. Research Methodology
- 3.1 Data Collection Process
- 3.2 Market Trajectory Estimation
- 3.3 Market Size Calculation
4. Market Dynamics
- 4.1 Drivers
- 4.2 Restraints
- 4.3 Opportunities
- 4.4 Trends
- 4.5 Impact assessment of Market Dynamics
5. Value Chain Analysis
- 5.1 Hardware Vendors
- 5.2 Application/ Software
- 5.3 Edge Computing Solution Vendors
- 5.4 End Use Industry
6. Covid-19 Impact Assessment
- 6.1 Assessment of Degree of Impact of Covid-19 on Edge Computing Market
- 6.2 Region-Wise Quarterly Covid Impact Analysis
7. Porter's Five Forces Analysis
8. Macro Economic Indicator Outlook
- 8.1 IOT Industry Growth
- 8.2 IT Industry Growth
- 8.3 Smart City Development
- 8.4 DevOps Industry Growth
- 8.5 Rising Demand of 5G Adoption
9. Competitive Positioning - Global Edge Computing Market
- 9.1 Companies - Component Positioning
- 9.2 Market Position Matrix
- 9.3 Market Share Analysis
- 9.3.1 Microsoft Corporation
- 9.3.2 SAP SE
- 9.3.3 Cisco Systems, Inc.
- 9.3.4 Amazon.com, Inc.
- 9.3.5 ABB
- 9.3.6 Huawei Technologies Co., Ltd.
- 9.3.7 Rockwell Automation, Inc.
- 9.3.8 Honeywell International Inc.
- 9.3.9 General Electric Company
- 9.3.10 Hewlett Packard Enterprise
10. Global Edge Computing Market Trends and Forecast Analysis, 2018-2028, USD Billion & CAGR
- 10.1 Macro Economic Factor Impact Index
- 10.2 Global Edge Computing Market: Dashboard
- 10.3 Global Edge Computing Market Size, By Value, 2018-2021 (USD Billion)
- 10.4 Global Edge Computing Market Size, By Value, 2022-2028 (USD Billion)
- 10.5 Global Edge Computing Market: Summary
11. Global Edge Computing Market Trend And Forecast Analysis, 2018-2028, By Component
- 11.1 Global Edge Computing Market Trend And Forecast Analysis, By Component: Snapshot
- 11.2 Hardware
- 11.3 Software
- 11.4 Service
12. Global Edge Computing Market Trend And Forecast Analysis, 2018-2028, By Application
- 12.1 Global Edge Computing Market Trend And Forecast Analysis, By Application: Snapshot
- 12.2 IIOT
- 12.3 Remote Monitoring
- 12.4 AR and VR
- 12.5 Content Delivery
- 12.6 Others
13. Global Edge Computing Market Trend And Forecast Analysis, 2018-2028, By End-User
- 13.1 Global Edge Computing Market Trend And Forecast Analysis, By End-User: Snapshot
- 13.2 BFSI
- 13.3 Retail and Consumer
- 13.4 Healthcare and Life Sciences
- 13.5 Industrial
- 13.6 Energy and Materials
- 13.7 Telecommunications
- 13.8 Others
14. Global Edge Computing Market Trend And Forecast Analysis, 2018-2028, By Region
- 14.1 Regional Coverage of the Study
15. Americas Edge Computing Market Trends and Forecast Analysis, 2018-2028, USD Billion & CAGR
- 15.1 Macro Economic Factor Impact Index
- 15.2 Impact analysis of market dynamics on Edge Computing Market
- 15.3 Americas Edge Computing Market: Snapshot
- 15.4 Americas Edge Computing Market: Dashboard
- 15.5 Americas Edge Computing Market Size, By Value, 2018-2021(USD Billion)
- 15.6 Americas Edge Computing Market Size, By Value, 2022-2028 (USD Billion)
- 15.7 Americas Edge Computing Market Trend And Forecast Analysis: Segmentation
- 15.7.1 By Component
- 15.7.2 By Application
- 15.7.3 By End-User
- 15.7.4 By Country
- 15.7.4.1 United States
- 15.7.4.2 Canada
- 15.7.4.3 Mexico
- 15.7.4.4 Brazil
- 15.7.4.5 Rest of Americas
16. Europe Edge Computing Market Trends and Forecast Analysis, 2018-2028, USD Billion & CAGR
- 16.1 Macro Economic Factor Impact Index
- 16.2 Impact analysis of market dynamics on Edge Computing Market
- 16.3 Europe Edge Computing Market: Snapshot
- 16.4 Europe Edge Computing Market: Dashboard
- 16.5 Europe Edge Computing Market Size, By Value, 2018-2021(USD Billion)
- 16.6 Europe Edge Computing Market Size, By Value, 2022-2028 (USD Billion)
- 16.7 Europe Edge Computing Market Trend And Forecast Analysis: Segmentation
- 16.7.1 By Component
- 16.7.2 By Application
- 16.7.3 By End-User
- 16.7.4 By Country
- 16.7.4.1 Germany
- 16.7.4.2 United Kingdom
- 16.7.4.3 France
- 16.7.4.4 Rest of Europe
17. Asia Pacific Edge Computing Market Trends and Forecast Analysis, 2018-2028, USD Billion & CAGR
- 17.1 Macro Economic Factor Impact Index
- 17.2 Impact analysis of market dynamics on Edge Computing Market
- 17.3 Asia Pacific Edge Computing Market: Snapshot
- 17.4 Asia Pacific Edge Computing Market: Dashboard
- 17.5 Asia Pacific Edge Computing Market Size, By Value, 2018-2021(USD Billion)
- 17.6 Asia Pacific Edge Computing Market Size, By Value, 2022-2028 (USD Billion)
- 17.7 Asia Pacific Edge Computing Market Trend And Forecast Analysis: Segmentation
- 17.7.1 By Component
- 17.7.2 By Application
- 17.7.3 By End-User
- 17.7.4 By Country
- 17.7.4.1 China
- 17.7.4.2 Japan
- 17.7.4.3 South Korea
- 17.7.4.4 Rest of Asia Pacific
18. Middle East and Africa Edge Computing Market Trends and Forecast Analysis, 2018-2028, USD Billion & CAGR
- 18.1 Impact analysis of market dynamics on Edge Computing Market
- 18.2 Middle East and Africa Edge Computing Market: Snapshot
- 18.3 Middle East and Africa Edge Computing Market Size, By Value, 2018-2021 (USD Billion)
- 18.4 Middle East and Africa Edge Computing Market Size, By Value, 2022-2028 (USD Billion)
- 18.5 Middle East and Africa Edge Computing Market Trend And Forecast Analysis: Segmentation
- 18.5.1 By Component
- 18.5.2 By Application
- 18.5.3 By End-User