|
|
市場調査レポート
商品コード
1109046
マーチャントアクワイアリングの世界市場 - 種類別・エンドユーザー別・流通チャネル別・技術別・地域別・国別の分析 (2022年版):市場の考察・予測、新型コロナウイルス感染症 (COVID-19) の影響 (2022年~2027年)Global Merchant Acquiring Market - Analysis By Type, End-User, Distribution Channel, Technology, By Region, By Country (2022 Edition): Market Insights and Forecast with Impact of COVID-19 (2022-2027) |
||||||
|
|
|||||||


| マーチャントアクワイアリングの世界市場 - 種類別・エンドユーザー別・流通チャネル別・技術別・地域別・国別の分析 (2022年版):市場の考察・予測、新型コロナウイルス感染症 (COVID-19) の影響 (2022年~2027年) |
|
出版日: 2022年07月31日
発行: Azoth Analytics
ページ情報: 英文 175 Pages
納期: 即納可能
|
- 全表示
- 概要
- 図表
- 目次
エグゼクティブサマリー
世界のマーチャントアクワイアリング市場の2021年における市場規模は約249億1,000万米ドルです。決済のキャッシュレス化が進み、インクルージョンを促進するための業界の役割が重要視されるようになっています。カードアクワイアリング業界は、小売業者や加盟店にカード決済取引を迅速かつ効果的に処理するためのプラットフォームを提供することで、時間の経過とともに徐々に発展してきました。
この10年間で、マーチャントアクワイアリングはコモディティ化し、この分野の企業は、取引量に対するマージンを下げることでオファーを差別化しています。この分野での今後の成長は、既存の顧客に付加価値の高いサービスを提供し、中小企業市場で新しいビジネスを創造する、グレードアップした「マーチャントアクワイアラー」を創出することです。消費者や企業にとって、コストの削減、利便性の向上、セキュリティの強化を約束するキャッシュレスへの移行などの要因が、マーチャント・アクイライジング市場を牽引しています。
マーチャントアクワイアリング市場では、リテール分野が大きなシェアを占めています。人口の増加、急速な都市化、可処分所得の増加、消費者の嗜好の変化などが小売セグメントを牽引する要因となっており、結果としてキャッシュレス取引が多くなっています。マーチャントアクワイアリングは、レストランやホテルなど、顧客が手間をかけずに素早くカード決済を行うことができ、収益性の高いビジネスの1つとなっています。
マーチャントアクワイアリング市場は、米国を中心に南北アメリカ地域が大きなシェアを占めています。
目次
第1章 調査範囲・手法
第2章 戦略提言
第3章 世界のマーチャントアクワイアリング市場:商品概要
第4章 世界のマーチャントアクワイアリング市場の分析
- 世界のマーチャントアクワイアリング市場:マクロ経済指標の評価
- 世界のマーチャントアクワイアリング市場:市場規模 (金額ベース、2017年~2027年)
- 世界のマーチャントアクワイアリング市場:成長と予測
- COVID-19が世界のマーチャントアクワイアリング市場に与える影響
第5章 世界のマーチャントアクワイアリング市場:セグメント別分析 (種類別)
- 世界のマーチャントアクワイアリング市場:種類別の内訳
- マーチャントアクワイアリング市場の競合ポジショニング:種類別 (2021年・2027年)
- デビットカード (単位:100万米ドル、2017年~2027年)
- クレジットカード (単位:100万米ドル、2017年~2027年)
第6章 世界のマーチャントアクワイアリング市場:セグメント別分析 (エンドユーザー別)
- 世界のマーチャントアクワイアリング市場:エンドユーザー別の内訳
- マーチャントアクワイアリング市場の競合ポジショニング:エンドユーザー別 (2021年・2027年)
- 小売店舗 (単位:100万米ドル、2017年~2027年)
- ホテル・レストラン (単位:100万米ドル、2017年~2027年)
- 医療施設 (単位:100万米ドル、2017年~2027年)
- その他 (単位:100万米ドル、2017年~2027年)
第7章 世界のマーチャントアクワイアリング市場:地域別分析
- 世界のマーチャントアクワイアリング市場の競合ポジショニング:地域別 (2021年・2027年)
第8章 南北アメリカのマーチャントアクワイアリング市場の分析 (2017年~2027年)
- 南北アメリカのマーチャントアクワイアリング市場:市場指標
- 南北アメリカのマーチャントアクワイアリング市場:規模と予測 (金額ベース、2017年~2027年)
- 南北アメリカのマーチャントアクワイアリング市場:大手企業
- 南北アメリカのマーチャントアクワイアリング市場:セグメント別分析
- 南北アメリカのマーチャントアクワイアリング市場:種類別 (デビットカード、クレジットカード)
- 南北アメリカのマーチャントアクワイアリング市場:エンドユーザー別 (小売店舗、ホテル・レストラン、医療、その他)
- 南北アメリカのマーチャントアクワイアリング市場:国別分析
- 南北アメリカのマーチャントアクワイアリング市場:市場機会チャート、国別 (2027年)
- 南北アメリカのマーチャントアクワイアリング市場:競合ポジショニング、国別
- 米国のマーチャントアクワイアリング市場
- カナダのマーチャントアクワイアリング市場
第9章 欧州のマーチャントアクワイアリング市場の分析 (2017年~2027年)
- 欧州のマーチャントアクワイアリング市場:市場指標
- 欧州のマーチャントアクワイアリング市場:規模と予測 (金額ベース、2017年~2027年)
- 欧州のマーチャントアクワイアリング市場:大手企業
- 欧州のマーチャントアクワイアリング市場:セグメント別分析
- 欧州のマーチャントアクワイアリング市場:種類別 (デビットカード、クレジットカード)
- 欧州のマーチャントアクワイアリング市場:エンドユーザー別 (小売店舗、ホテル・レストラン、医療、その他)
- 欧州のマーチャントアクワイアリング市場:国別分析
- 欧州のマーチャントアクワイアリング市場:市場機会チャート、国別 (2027年)
- 欧州のマーチャントアクワイアリング市場:競合ポジショニング、国別
- 英国のマーチャントアクワイアリング市場
- ドイツのマーチャントアクワイアリング市場
- フランスのマーチャントアクワイアリング市場
- イタリアのマーチャントアクワイアリング市場
第10章 アジア太平洋のマーチャントアクワイアリング市場の分析 (2017年~2027年)
- アジア太平洋のマーチャントアクワイアリング市場:市場指標
- アジア太平洋のマーチャントアクワイアリング市場:規模と予測 (金額ベース、2017年~2027年)
- アジア太平洋のマーチャントアクワイアリング市場:大手企業
- アジア太平洋のマーチャントアクワイアリング市場:セグメント別分析
- アジア太平洋のマーチャントアクワイアリング市場:種類別 (デビットカード、クレジットカード)
- アジア太平洋のマーチャントアクワイアリング市場:エンドユーザー別 (小売店舗、ホテル・レストラン、医療、その他)
- アジア太平洋のマーチャントアクワイアリング市場:国別分析
- アジア太平洋のマーチャントアクワイアリング市場:市場機会チャート、国別 (2027年)
- アジア太平洋のマーチャントアクワイアリング市場:競合ポジショニング、国別
- 中国のマーチャントアクワイアリング市場
- 日本のマーチャントアクワイアリング市場
- インドのマーチャントアクワイアリング市場
- 韓国のマーチャントアクワイアリング市場
第11章 中東・アフリカのマーチャントアクワイアリング市場
- 南北アメリカのマーチャントアクワイアリング市場:市場指標
- 南北アメリカのマーチャントアクワイアリング市場:規模と予測 (金額ベース、2017年~2027年)
第12章 世界のマーチャントアクワイアリングの市場力学
- 世界のマーチャントアクワイアリング市場の促進要因
- 世界のマーチャントアクワイアリング市場の抑制要因
- 世界のマーチャントアクワイアリング市場の動向
第13章 市場の魅力と戦略分析
- 世界のマーチャントアクワイアリング市場の魅力度チャート:種類別 (2027年)
- 世界のマーチャントアクワイアリング市場の魅力度チャート:エンドユーザー別 (2027年)
- 世界のマーチャントアクワイアリング市場の魅力度チャート:地域別 (2027年)
第14章 競合情勢
- 世界の大手企業の市場シェア
第15章 企業プロファイル (事業内容、財務分析、事業戦略)
- Fiserv, Inc.
- JPMorgan Chase & Co.
- Fidelity National Information Services, Inc. (FIS)
- Sberbank
- Bank of America
- Global Payments Inc.
- Adyen
- SHIFT4 PAYMENTS, INC.
- Citigroup Inc.
- China UMS
List of Figures
List of Figures
- Figure 1: Global Number of Non Cash Transaction,2020 (in Billion)
- Figure 2: Global number of Smartphone Users, 2018-2021, in Millions
- Figure 3: Number of Non Cash Transactions in the Top 10 Markets (in Billion), 2019
- Figure 4: Global International Tourist Arrivals, By Leading Countries 2019 (In Million)
- Figure 5: Payment Card Projected Worldwide, 2020, (In Billion)
- Figure 6: Global Merchant Acquiring Market Size, By Value, 2017-2027 (USD Millions)
- Figure 7: MasterCard/Visa Share of Purchase Volume at Top Acquirers,2020
- Figure 8: Global Merchant Acquiring Market- By Type Market Share, 2021 & 2027
- Figure 9: Global Merchant Acquiring Market- By Type, By Debit Card, By Value (USD Millions), 2017-2027
- Figure 10: Global Merchant Acquiring Market- By Type, Cooking Appliances, By Value (USD Millions), 2017-2027
- Figure 11: Global Merchant Acquiring Market- By End User Market Share, 2021 & 2027
- Figure 12: Global Merchant Acquiring Market- By End User, By Retail, By Value (USD Millions), 2017-2027
- Figure 13: Global Merchant Acquiring Market- By Hotels and Restaurants, By Value (USD Millions), 2017-2027
- Figure 14: Global Merchant Acquiring Market- By Healthcare, By Value (USD Millions), 2017-2027
- Figure 15: Global Merchant Acquiring Market- By Others, By Value (USD Millions), 2017-2027
- Figure 16: Global Merchant Acquiring Market- By Region Market Share, 2021 & 2027
- Figure 17: North Americas International Tourism Number of Arrivals, 2017-2019 (In Millions)
- Figure 18: North Americas International Tourism Number of Departure, 2017-2019 (In Millions)
- Figure 19: To Acquirers in Latin America, 2020
- Figure 20: North America Population by Age Group, (in Million), 2018-20
- Figure 21: Americas Merchant Acquiring Market Size, By Value, 2017-2027 (USD Millions)
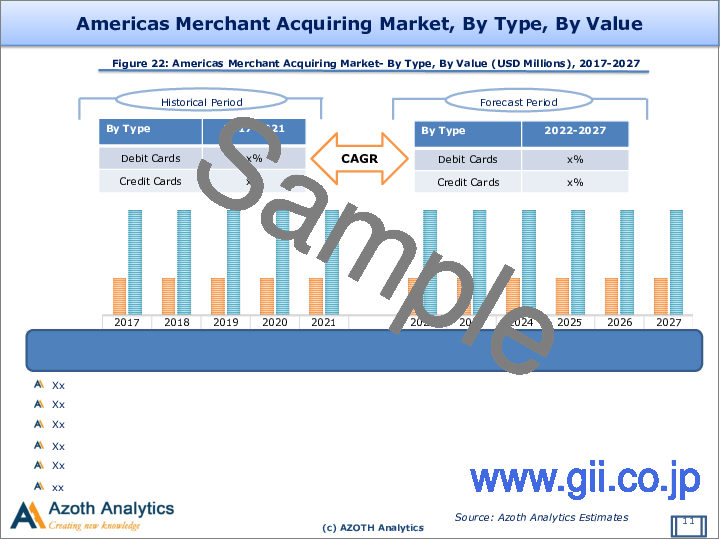
- Figure 22: Americas Merchant Acquiring Market- By Type, By Value (USD Millions), 2017-2027
- Figure 23: Americas Merchant Acquiring Market- By End User, By Value (USD Millions), 2017-2027
- Figure 24: Market Opportunity Chart of Americas Merchant Acquiring Market- By Country, By Value (Year-2027)
- Figure 25: Americas Merchant Acquiring Market- By Country Market Share, 2021 & 2027
- Figure 26: U.S. Consumer Payment System (in USD Billions) , 2016, 2021, 2026e
- Figure 27: U.S. Consumer Payment System (in Billions) , 2020
- Figure 28: Top U.S. Merchant Acquirers,2020, in USD Billions
- Figure 29: United States Merchant Acquiring Market Size, By Value, 2017-2027 (USD Millions)
- Figure 30: United States Merchant Acquiring Market- By Type, By Value (USD Millions), 2017-2027
- Figure 31: United States Merchant Acquiring Market- By End User, By Value (USD Millions), 2017-2027
- Figure 32: Card Volume in Canada, 2020, in Million Transactions
- Figure 33: Canada Card Networks and Issuers, 2020
- Figure 34: Breakdown of acquirer charges borne by small and medium sized businesses
- Figure 35: Canada Merchant Acquiring Market Size, By Value, 2017-2027 (USD Millions)
- Figure 36: Canada Merchant Acquiring Market- By Type, By Value (USD Millions), 2017-2027
- Figure 37: Canada Merchant Acquiring Market- By End User, By Value (USD Millions), 2017-2027
- Figure 38: Number of International tourist arrivals in Europe, 2018-2021
- Figure 39: Smartphone users in Europe, (in Million), 2020
- Figure 40: Europe Global Network Cards, in Billions, 2020-2021
- Figure 41: Europe Top Merchant Acquirers, in Billions, 2021
- Figure 42: Europe Merchant Acquiring Market Size, By Value, 2017-2027 (USD Millions)
- Figure 43: Europe Merchant Acquiring Market- By Type, By Value (USD Millions), 2017-2027
- Figure 44: Europe Merchant Acquiring Market- By End User, By Value (USD Millions), 2017-2027
- Figure 45: Market Opportunity Chart of Europe Merchant Acquiring Market- By Country, By Value (Year-2027)
- Figure 46: Europe Merchant Acquiring Market- By Country Market Share, 2021 & 2027
- Figure 47: United Kingdom Merchant Acquiring Market Size, By Value, 2017-2027 (USD Millions)
- Figure 48: United Kingdom Merchant Acquiring Market- By Type, By Value (USD Millions), 2017-2027
- Figure 49: United Kingdom Merchant Acquiring Market- By End User, By Value (USD Millions), 2017-2027
- Figure 50: Germany Merchant Acquiring Market Size, By Value, 2017-2027 (USD Millions)
- Figure 51: Germany Merchant Acquiring Market- By Type, By Value (USD Millions), 2017-2027
- Figure 52: Germany Merchant Acquiring Market- By End User, By Value (USD Millions), 2017-2027
- Figure 53: France Merchant Acquiring Market Size, By Value, 2017-2027 (USD Millions)
- Figure 54: France Merchant Acquiring Market- By Type, By Value (USD Millions), 2017-2027
- Figure 55: France Merchant Acquiring Market- By End User, By Value (USD Millions), 2017-2027
- Figure 56: Italy Merchant Acquiring Market Size, By Value, 2017-2027 (USD Millions)
- Figure 57: Italy Merchant Acquiring Market- By Type, By Value (USD Millions), 2017-2027
- Figure 58: Italy Merchant Acquiring Market- By End User, By Value (USD Millions), 2017-2027
- Figure 59: Asia Pacific Internet Penetration, 2017-2020 ( in %)
- Figure 60: Asia and Pacific Population by Age Group, (in Million), 2018-20
- Figure 61: East Asia Pacific International Tourism Number of Arrivals, 2017-2019 (In Millions)
- Figure 62: East Asia Pacific International Tourism Number of Departure, 2017-2019 (In Millions)
- Figure 63: Asia-Pacific Global Network Cards, in Billion, 2019-2020
- Figure 64: Credit Card Penetration in the Asia Pacific, by Country , in %
- Figure 65: Asia Pacific Merchant Acquiring Market Size, By Value, 2017-2027 (USD Millions)
- Figure 66: Asia Pacific Merchant Acquiring Market- By Type, By Value (USD Millions), 2017-2027
- Figure 67: Asia Pacific Merchant Acquiring Market- By End User, By Value (USD Millions), 2017-2027
- Figure 68: Market Opportunity Chart of APAC Merchant Acquiring Market- By Country, By Value (Year-2027)
- Figure 69: APAC Merchant Acquiring Market- By Country Market Share, 2021 & 2027
- Figure 70: China Merchant Acquiring Market Size, By Value, 2017-2027 (USD Millions)
- Figure 71: China Merchant Acquiring Market- By Type, By Value (USD Millions), 2017-2027
- Figure 72: China Merchant Acquiring Market- By End User, By Value (USD Millions), 2017-2027
- Figure 73: Japan Merchant Acquiring Market Size, By Value, 2017-2027 (USD Millions)
- Figure 74: Japan Merchant Acquiring Market- By Type, By Value (USD Millions), 2017-2027
- Figure 75: Japan Merchant Acquiring Market- By End User, By Value (USD Millions), 2017-2027
- Figure 76: India Merchant Acquiring Market Size, By Value, 2017-2027 (USD Millions)
- Figure 77: India Merchant Acquiring Market- By Type, By Value (USD Millions), 2017-2027
- Figure 78: India Merchant Acquiring Market- By End User, By Value (USD Millions), 2017-2027
- Figure 79: South Korea Merchant Acquiring Market Size, By Value, 2017-2027 (USD Millions)
- Figure 80: South Korea Merchant Acquiring Market- By Type, By Value (USD Millions), 2017-2027
- Figure 81: South Korea Merchant Acquiring Market- By End User, By Value (USD Millions), 2017-2027
- Figure 82: Middle East and North Africa Population (in Million), 2018-2020
- Figure 83: Individuals using the Internet (% of population), Middle East and North Africa, 2018-2020
- Figure 84: Merchant Acquirers in Middle East and Africa, Purchase Transactions, in Millions, 2021
- Figure 85: MEA Merchant Acquiring Market Size, By Value, 2017-2027 (USD Millions)
- Figure 86: Market Attractiveness Chart of Global Merchant Acquiring Market- By Type(Year-2027)
- Figure 87: Market Attractiveness Chart of Global Merchant Acquiring Market- By End User (Year-2027)
- Figure 88: Market Attractiveness Chart of Global Merchant Acquiring Market- By Region (Year-2027)
- Figure 89: Global Merchant Acquiring Market Share (%), 2020
- Figure 90: Fiserv, Inc., Ltd.Sales Revenues, 2017-2021 (USD Millions)
- Figure 91: Fiserv, Inc., Net Income, 2017-2021 (USD Millions)
- Figure 92: Fiserv, Inc., Ltd., By Business Segment (%), FY2021
- Figure 93: Fiserv, Inc., Ltd., By Geographical Segment (%), FY2021
- Figure 94: JPMorgan Chase & Co. Sales Revenues, 2017-2021 (USD Millions)
- Figure 95: JPMorgan Chase & Co. Net Income, 2017-2021 (USD Millions)
- Figure 96: Daily Payment Processing (and Merchant Acquiring Transactions
- Figure 97: JPMorgan Chase & Co., By Business Segment (%), FY2021
- Figure 98: JPMorgan Chase & Co. , By Geographical Segment (%), FY2021
- Figure 99: Fidelity National Information Services, Inc.(FIS), Annual Sales Revenue, 2017-2021 (USD Millions)
- Figure 100: Fidelity National Information Services, Inc.(FIS), Net Income, 2017-2021 (USD Millions)
- Figure 101: Fidelity National Information Services, Inc.(FIS), Net Sales Revenue, By Business Segment (%), FY2021
- Figure 102: Fidelity National Information Services, Inc.(FIS), Sales Revenue, By Geographic Segment (%), FY2021
- Figure 103: Sberbank, Annual Sales Revenue, 2019-2021 (USD Millions)
- Figure 104: Sberbank, Gross Profit, 2019-2021 (USD Millions)
- Figure 105: Sberbank, Sales Revenue, By Business Segment (%), FY2021
- Figure 106: Sberbank, Sales Revenue, By Business Segment (%), FY2020
- Figure 107: Bank of America, Annual Sales Revenue, 2017-2021 (USD Millions)
- Figure 108: Bank of America, Net Income, 2017-2021 (USD Millions)
- Figure 109: Bank of America, Sales Revenue, By Business Segment (%), FY2021
- Figure 110: Bank of America, Sales Revenue, By Geographical Segment (%), FY2021
- Figure 111: Global Payments Inc., Annual Sales Revenue, 2017-2021 (USD Millions)
- Figure 112: Global Payments Inc., Net Income, 2017-2021 (USD Millions)
- Figure 113: Global Payments Inc., Sales Revenue, By Business Segment (%), FY2021
- Figure 114: Global Payments Inc., Sales Revenue, By Geographical Segment (%), FY2021
- Figure 115: Adyen, Annual Sales Revenue, 2017-2021 (USD Millions)
- Figure 116: Adyen, Net Income, 2017-2021 (USD Millions)
- Figure 117: Adyen, Sales Revenue, By Geographical Segment (%), FY2021
- Figure 118: Adyen, Sales Revenue, By Geographical Segment (%), FY2020
- Figure 119: SHIFT4 PAYMENTS, INC., Annual Sales Gross Revenue, 2018-2021 (USD Millions)
- Figure 120: SHIFT4 PAYMENTS, INC., Net Loss, 2018-2021 (USD Millions)
- Figure 121: Citigroup Inc., Annual Sales Revenue, 2017-2021 (USD Millions)
- Figure 122: Citigroup Inc., Net Profit/loss, 2017-2021 (USD Millions)
- Figure 123: Citigroup Inc., Sales Revenue, By Business Segment (%), FY2021
- Figure 124: Citigroup Inc., Sales Revenue, By Geographical Segment (%), FY2021
Executive Summary
According to a research report published by Azoth Analytics in July 2021, the Global Merchant Acquiring Market was valued at around USD 24.91 billion in the year 2021. Payments are becoming increasingly cashless, and the industry's role in fostering inclusion has become a significant priority. The card acquiring industry has developed progressively over time by giving retailers and merchants a platform to quickly and effectively handle card payment transactions.
Over the last 10 years, merchant acquiring has evolved into a commodity, and players in the field are now differentiating their offers by lowering margins on transactional volume. Future-oriented growth in this space is to create an upgraded 'Merchant Acquirer' that will deliver value-added services to existing customers and create new business in the SME market. Factors such as the shift to cashless promises to lower costs, increase convenience, and greater security for consumers and businesses is driving the merchant acquiring market.
The retail segment accounts for the major share of the Merchant Acquiring market. Increasing population, rapid urbanization, increasing disposable income and changing consumer preference are factors driving the retail segment, resulting in a high number of cashless transactions. Merchant acquiring business is one of the profitable businesses in the restaurants and hotels segment where customers can check in with hassle-free and quick card payments.
Americas region holds the major Merchant Acquiring Market share with the U.S. Merchant Acquiring Market driven by a surge in innovation, an enthusiastic community of new entrants, and a proliferation of new payment experiences.
Scope of the Report
- The report analyses the Merchant Acquiring Market By Value (USD Million), by Volume (in numbers)
- The report analyses the Merchant Acquiring Market By Type (Debit Card, Credit Card)
- The report analyses the Merchant Acquiring Market By End-User (Retail, Hotels and Restaurants, Healthcare, Others)
- The Global Merchant Acquiring Market has been analysed by Countries (United States, Canada, Germany, U.K, France, Italy, China, Japan, India, South Korea)
- The key insights of the report have been presented through the frameworks of the company's SWOT Analysis, and Porter's Five Forces Analysis. Also, the attractiveness of the market has been presented by Region, By Type, By End-User
- Also, the major opportunities, trends, drivers and challenges of the industry have been analysed in the report.
- The report tracks competitive developments, strategies, mergers and acquisitions, and new product development. The companies analysed in the report include - Fiserv, Inc., JPMorgan Chase & Co., Fidelity National Information Services, Inc. (FIS), Sberbank, Bank of America, Global Payments Inc., Adyen, SHIFT4 PAYMENTS, INC., Citigroup Inc., China UMS
- The report presents the analysis of the Merchant Acquiring Market for the historical period of 2017-2021 and the forecast period of 2022-2027
Key Target Audience
- Merchant Acquiring Market Players
- Financial and Non-Financial Corporates, Retailers etc.
- Government and Policy Makers
- Regulatory Authorities
Table of Contents
1. Report Scope and Methodology
- 1.1 Scope of the Report
- 1.2 Research Methodology
- 1.3 Executive Summary
2. Strategic Recommendations
3. Global Merchant Acquiring Market: Product Overview
4. Global Merchant Acquiring Market: An Analysis
- 4.1. Assessment of Macro Economic Indicators of Global Merchant Acquiring Market
- 4.2 Global Merchant Acquiring Market, Market Size, By Value, 2017-2027
- 4.3 Global Merchant Acquiring Market: Growth and Forecast
- 4.4 Impact of COVID-19 on Global Merchant Acquiring Market
5. Global Merchant Acquiring Market: Segment Analysis
- 5.1 Global Merchant Acquiring Market Segmentation, By Type
- 5.2 Global Merchant Acquiring Market Segmentation, By Type
- 5.3 Competitive Positioning of Merchant Acquiring Market: By Type (2021 & 2027)
- 5.4 By Debit Cards, By Value (USD Millions), 2017-2027
- 5.5 By Credit Cards, By Value (USD Millions), 2017-2027
6. Global Merchant Acquiring Market: Segment Analysis
- 6.1 Global Merchant Acquiring Market Segmentation, By End User
- 6.2 Competitive Positioning of Global Merchant Acquiring Market, By End User (2021 & 2027)
- 6.3 By Retail, By value (USD Millions), 2017-2027
- 6.4 By Hotels and Restaurants, By Value (USD Millions), 2017-2027
- 6.5 By Healthcare, By value (USD Millions), 2017-2027
- 6.6 By Others, By Value (USD Millions), 2017-2027
7. Global Merchant Acquiring Market: Regional Analysis
- 7.1 Competitive Positioning of Global Merchant Acquiring Market: By Region (2021 & 2027)
8. Americas Merchant Acquiring Market: An Analysis (2017-2027)
- 8.1 Americas Point-of-Sale (POS) Terminal Market: Market Indicators
- 8.2 Americas Merchant Acquiring Market- Size and Forecast, By Value (2017-2027)
- 8.3 Americas Merchant Acquiring Market: Prominent Companies
- 8.4 Americas Merchant Acquiring Market: Segment Analysis
- 8.5 Americas Merchant Acquiring Market By Type, (Debit Cards, Credit Cards)
- 8.6 Americas Merchant Acquiring Market By End User, (Retail, Hotels and Restaurants, Healthcare, Others), By Value
- 8.7 Americas Merchant Acquiring Market: Country Analysis
- 8.8 Market Opportunity Chart of Americas Merchant Acquiring Market - By Country, By Value (Year-2027)
- 8.09 Competitive Positioning of Americas Merchant Acquiring Market - By Country
- 8.10 United States Merchant Acquiring Market: Size and Forecast, By Value (2017-2027)
- 8.11 United States Merchant Acquiring Market By Type, By End User, By Value (2017-2027)
- 8.12 Canada Merchant Acquiring Market: Size and Forecast, By Value (2017-2027)
- 8.13 Canada Merchant Acquiring Market By Type, By End User, By Value (2017-2027)
9. Europe Merchant Acquiring Market: An Analysis (2017-2027)
- 9.1 Europe Merchant Acquiring Market: Market Indicators
- 9.2 Europe Merchant Acquiring Market- Size and Forecast, By Value (2017-2027)
- 9.3 Europe Merchant Acquiring Market: Prominent Companies
- 9.4 Europe Merchant Acquiring Market: Segment Analysis
- 9.5 Europe Merchant Acquiring Market By Type (Debit Cards, Credit Cards)
- 9.6 Europe Merchant Acquiring Market By End User, (Retail, Hotels and Restaurants, Healthcare, Others), By Value
- 9.7 Europe Merchant Acquiring Market: Country Analysis
- 9.8 Market Opportunity Chart of Europe Merchant Acquiring Market - By Country, By Value (Year-2027)
- 9.9 Competitive Positioning of Europe Merchant Acquiring Market - By Country
- 9.10 United Kingdom Merchant Acquiring Market: Size and Forecast, By Value (2017-2027)
- 9.11 United Kingdom Merchant Acquiring Market By Type, By End User, By Value (2017-2027)
- 9.12 Germany Merchant Acquiring Market: Size and Forecast, By Value (2017-2027)
- 9.13 Germany Merchant Acquiring Market By Type, By End User, By Value (2017-2027)
- 9.14 France Merchant Acquiring Market: Size and Forecast, By Value (2017-2027)
- 9.15 France Merchant Acquiring Market By Type, By End User, By Value (2017-2027)
- 9.16 Italy Merchant Acquiring Market: Size and Forecast, By Value (2017-2027)
- 9.17 Italy Merchant Acquiring Market By Type, By End User, By Value (2017-2027)
10. Asia Pacific Merchant Acquiring Market: An Analysis (2017-2027)
- 10.1 Assessment of Macro Economic Indicators of Asia Pacific Merchant Acquiring Market
- 10.2 Asia Pacific Merchant Acquiring Market- Size and Forecast, By Value (2017-2027)
- 10.3 Asia Pacific Merchant Acquiring Market: Prominent Companies
- 10.4 Asia Pacific Merchant Acquiring Market: Segment Analysis
- 10.5 Asia Pacific Merchant Acquiring Market By Type (Debit Cards, Credit Cards)
- 10.6 Asia Pacific Merchant Acquiring Market By End User, (Retail, Hotels and Restaurants, Healthcare, Others), By Value
- 10.7 Asia Pacific Merchant Acquiring Market: Country Analysis
- 10.8 Market Opportunity Chart of Asia Pacific Merchant Acquiring Market - By Country, By Value (Year-2027)
- 10.9 Competitive Positioning of Asia Pacific Merchant Acquiring Market - By Country
- 10.10 China Merchant Acquiring Market: Size and Forecast, By Value (2017-2027)
- 10.11 China Merchant Acquiring Market By Type, By End User, By Value (2017-2027)
- 10.12 Japan Merchant Acquiring Market: Size and Forecast, By Value (2017-2027)
- 10.13 Japan Merchant Acquiring Market By Type, By End User, By Value (2017-2027)
- 10.14 India Merchant Acquiring Market: Size and Forecast, By Value (2017-2027)
- 10.15 India Merchant Acquiring Market By Type, By End User, By Value (2017-2027)
- 10.16 South Korea Merchant Acquiring Market: Size and Forecast, By Value (2017-2027)
- 10.17 South Korea Merchant Acquiring Market By Type, By End User, By Value (2017-2027)
11. MEA Merchant Acquiring Market
- 11.1 MEA Merchant Acquiring Market: Market Indicators
- 11.2 MEA Merchant Acquiring Market- Size and Forecast, By Value (2017-2027)
12. Global Merchant Acquiring Market Dynamics
- 12.1 Global Merchant Acquiring Market Drivers
- 12.2 Global Merchant Acquiring Market Restraints
- 12.3 Global Merchant Acquiring Market Trends
13. Market Attractiveness and Strategic Analysis
- 13.1 Market Attractiveness Chart of Global Merchant Acquiring Market - By Type (2027)
- 13.2 Market Attractiveness Chart of Global Merchant Acquiring Market - By End User (2027)
- 13.3 Market Attractiveness Chart of Global Merchant Acquiring Market - By Region (2027)
14. Competitive Landscape
- 14.1 Market Share of global leading companies
15. Company Profiles (Business Description, Financial Analysis, Business Strategy)
- 15.1 Fiserv, Inc.
- 15.2 JPMorgan Chase & Co.
- 15.3 Fidelity National Information Services, Inc.(FIS)
- 15.4 Sberbank
- 15.5 Bank of America
- 15.6 Global Payments Inc.
- 15.7 Adyen
- 15.8 SHIFT4 PAYMENTS, INC.
- 15.9 Citigroup Inc.
- 15.10 China UMS