|
|
市場調査レポート
商品コード
1082039
液体包装の世界市場(2022年):包装形態別、技術別、材料別、最終用途産業別、地域別、国別分析::市場洞察、COVID-19の影響と予測(2017年~2027年)Global Liquid Packaging Market(2022 Edition): Analysis By Packaging Format, Technology, Material, End-Use Industry, By Region, By Country: Market Insights and Forecast with Impact of COVID-19 (2017-2027) |
||||||
|
|
|||||||


| 液体包装の世界市場(2022年):包装形態別、技術別、材料別、最終用途産業別、地域別、国別分析::市場洞察、COVID-19の影響と予測(2017年~2027年) |
|
出版日: 2022年05月31日
発行: Azoth Analytics
ページ情報: 英文 220 Pages
納期: 即納可能
|
- 全表示
- 概要
- 図表
- 目次
世界の液体包装の市場規模は、2021年に3,130億米ドルとなりました。同市場は、アジア太平洋地域が市場シェアをリードし、今後も大きく拡大すると予測されています。
当レポートでは、世界の液体包装市場について調査し、市場の概要とともに、包装形態別、技術別、材料別、最終用途産業別、地域別の動向、および市場に参入する企業のプロファイルなどを提供しています。目次
第1章 調査範囲と調査手法
第2章 戦略的推奨事項
第3章 世界の液体包装市場:製品概要
第4章 世界の液体包装市場:分析
第5章 世界の液体包装市場、包装形態別
- 世界の液体包装市場の競合シナリオ:包装形態別(2021年および2027年)
- リジッド-市場規模と予測(2017年~2027年)
- フレキシブル-市場規模と予測(2017年~2027年)
第6章 世界の液体包装市場のセグメンテーション、技術別
- 世界の液体包装市場の競合シナリオ:技術別(2021年および2027年)
- 無菌液体包装-市場規模と予測(2017年~2027年)
- ブロー成形-市場規模と予測(2017年~2027年)
- フォームフィルシール-市場規模と予測(2017年~2027年)
第7章 世界の液体包装市場のセグメンテーション、材料別
- 世界の液体包装市場の競合シナリオ:材料別(2021年および2027年)
- 紙-市場規模と予測(2017年~2027年)
- プラスチック-市場規模と予測(2017年~2027年)
- ガラス-市場規模と予測(2017年~2027年)
- 金属-市場規模と予測(2017年~2027年)
- その他-市場規模と予測(2017年~2027年)
第8章 世界の液体包装市場のセグメンテーション、最終用途産業別
- 世界の液体包装市場の競合シナリオ:最終用途産業別(2021年および2027年)
- 食品・飲料-市場規模と予測(2017年~2027年)
- パーソナルケア-市場規模と予測(2017年~2027年)
- 医薬品-市場規模と予測(2017年~2027年)
- その他-市場規模と予測(2017年~2027年)
第9章 世界の液体包装市場:地域別分析
- 世界の液体包装市場の競合シナリオ:地域別(2021年および2027年)
第10章 北米の液体包装市場:分析(2017年~2027年)
第11章 欧州の液体包装市場:分析(2017年~2027年)
第12章 アジア太平洋の液体包装市場:分析(2017年~2027年)
第13章 ラテンアメリカの液体包装市場
第14章 世界の液体包装市場力学
- 世界の液体包装市場の促進要因
- 世界の液体包装市場の抑制要因
- 世界の液体包装市場の動向
第15章 市場の魅力
第16章 競合情勢
第17章 主要な技術革新、合併と買収、および製造業者の役割
第18章 企業プロファイル(事業内容、財務分析、事業戦略)
- Tetra Pak
- Oji Holdings Corporation
- International Paper Company
- West Rock Company
- Dow Chemical Company
- Mondi Plc.
- Smurfit Kappa
- Amcor plc.
- ELOPAK
- Billerudkorsnas
List of Figures
List of Figures
- Figure 1: Global environmental concern of consumers, 2021, (in percentages)
- Figure 2: Paper and paperboard producing countries, (million metric ton), 2019
- Figure 3: Recovered Paper producing/ collection countries, (million metric ton), 2019
- Figure 4: Global environmentally friendly forms of packaging
- Figure 5: Global Liquid Packaging Market Size, By Value, 2017-2027 (USD Billion)
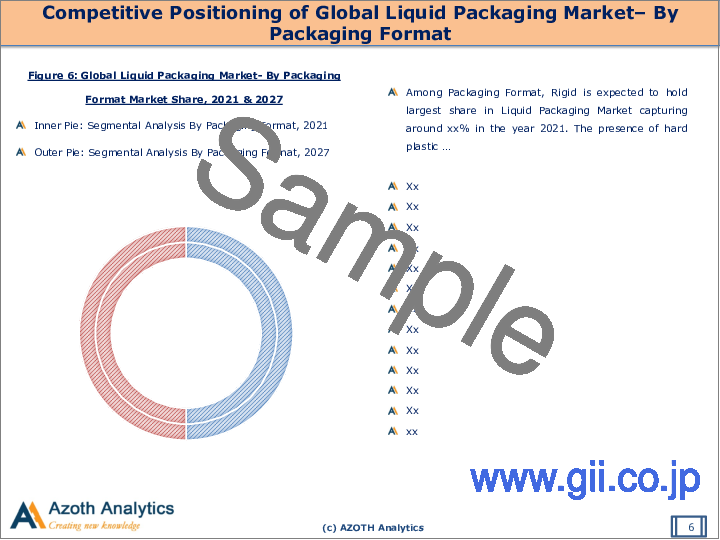
- Figure 6: Global Liquid Packaging Market- By Packaging Format Market Share, 2021 & 2027
- Figure 7: Global Liquid Packaging Market- By Packaging Format, By Rigid, By Value (USD Billion), 2017-2027
- Figure 8: Global Liquid Packaging Market- By Packaging Format, By Flexible, By Value (USD Billion), 2017-2027
- Figure 9: Global Liquid Packaging Market- By Technology Share, 2021 & 2027
- Figure 10: Global Liquid Packaging Market- By Technology, By Aseptic Liquid Packaging (USD Billion), 2017-2027
- Figure 11: Global Liquid Packaging Market- By Technology, By Blow Molding (USD Billion), 2017-2027
- Figure 12: Global Liquid Packaging Market- By Technology, By Form Fill Seal (USD Billion), 2017-2027
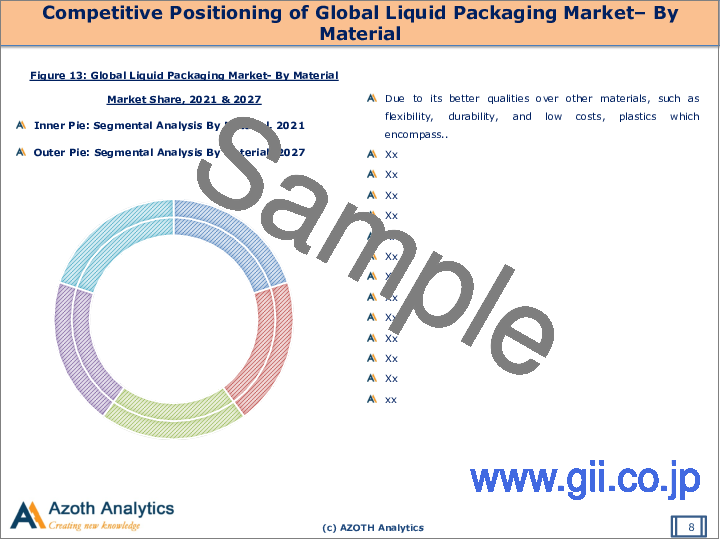
- Figure 13: Global Liquid Packaging Market- By Material Market Share, 2021 & 2027
- Figure 14: Global Liquid Packaging Market- By Material, By Paper (USD Billion), 2017-2027
- Figure 15: Global Liquid Packaging Market- By Material, By Plastics (USD Billion), 2017-2027
- Figure 16: Global Liquid Packaging Market- By Material, By Glass (USD Billion), 2017-2027
- Figure 17: Global Liquid Packaging Market- By Material, By Metal (USD Billion), 2017-2027
- Figure 18: Global Liquid Packaging Market- By Material, By Others (USD Billion), 2017-2027
- Figure 19: Global Liquid Packaging Market- By End Use Industry Market Share, 2021 & 2027
- Figure 20: Global Liquid Packaging Market- By End Use Industry, By Food and Beverages (USD Billion), 2017-2027
- Figure 21: Global Liquid Packaging Market- By End Use Industry, By Personal Care (USD Billion), 2017-2027
- Figure 22: Global Liquid Packaging Market- By End Use Industry, By Pharmaceutical (USD Billion), 2017-2027
- Figure 23: Global Liquid Packaging Market- By End Use Industry, By Others (USD Billion), 2017-2027
- Figure 24: Global Liquid Packaging Market- By Region Market Share, 2021 & 2027
- Figure 25: North America packaging market by material, 2020
- Figure 26: North America pulp and paperboard production, (in million metric tons), 2019
- Figure 27: North America recovered paper collection (in million metric tons), 2019
- Figure 28: North America packaging material growth rate, 2000-2020
- Figure 29: North America Liquid Packaging Market Size, By Value, 2017-2027 (USD Billion)
- Figure 30: North America Liquid Packaging Market- By Packaging Format, By Value (USD Billion), 2017-2027
- Figure 31: North America Liquid Packaging Market - By Technology, By Value (USD Billion), 2017-2027
- Figure 32: North America Liquid Packaging Market - By Material, By Value (USD Billion), 2017-2027
- Figure 33: North America Liquid Packaging Market - By End Use Industry, By Value (USD Billion), 2017-2027
- Figure 34: Market Opportunity Chart of North America Liquid Packaging Market- By Country, By Value (Year-2027)
- Figure 35: North America Liquid Packaging Market- By Country Market Share, 2021 & 2031
- Figure 36: U.S use of old corrugated containers, 2019
- Figure 37: U.S volume of beverage consumption, by segments, 2020
- Figure 38: U.S packaging market by segments, 2019 (%)
- Figure 39 United States Liquid Packaging Market Size, By Value, 2017-2027 (USD Billion)
- Figure 40: United States Liquid Packaging Market- By Packaging Format, By Value (USD Billion), 2017-2027
- Figure 41: United States Liquid Packaging Market - By Technology, By Value (USD Billion), 2017-2027
- Figure 42: United States Liquid Packaging Market - By Material, By Value (USD Billion), 2017-2027
- Figure 43: United States Liquid Packaging Market - By End Use Industry, By Value (USD Billion), 2017-2027
- Figure 44: Canada trade of paper and paperboard, 2019, (million metric tons)
- Figure 45: Canada recovered paper market, in million metric tons, 2019
- Figure 46: Canada packaging market in million metric tons, 2019
- Figure 47: Canada Liquid Packaging Market Size, By Value, 2017-2027 (USD Billion)
- Figure 48: Canada Liquid Packaging Market- By Packaging Format, By Value (USD Billion), 2017-2027
- Figure 49: Canada Liquid Packaging Market - By Technology, By Value (USD Billion), 2017-2027
- Figure 50: Canada Liquid Packaging Market - By Material, By Value (USD Billion), 2017-2027
- Figure 51: Canada Liquid Packaging Market - By End Use Industry, By Value (USD Billion), 2017-2027
- Figure 52: Europe production of corrugated packaging by countries (in million metric tons), 2019
- Figure 53: Europe turnover of food and drink industry, (in %), 2018
- Figure 54: Europe packaging market in million metric tons, 2019
- Figure 55: Europe Liquid Packaging Market Size, By Value, 2017-2027 (USD Billion)
- Figure 56: Europe Liquid Packaging Market- By Packaging Format, By Value (USD Billion), 2017-2027
- Figure 57: Europe Liquid Packaging Market - By Technology, By Value (USD Billion), 2017-2027
- Figure 58: Europe Liquid Packaging Market - By Material, By Value (USD Billion), 2017-2027
- Figure 59: Europe Liquid Packaging Market - By End Use Industry, By Value (USD Billion), 2017-2027
- Figure 60: Market Opportunity Chart of Europe Liquid Packaging Market- By Country, By Value (Year-2031)
- Figure 61: Europe Liquid Packaging Market- By Country Market Share, 2021 & 2031
- Figure 62: Germany trade of paper and paperboard, 2019, (million metric tons)
- Figure 63: Germany recovered paper market, in million metric tons, 2019
- Figure 64: Germany consumption and sale of fresh dairy products, in 1000 tons, 2016-2019
- Figure 65: Germany packaging market in million metric tons, 2019
- Figure 66: Germany Liquid Packaging Market Size, By Value, 2017-2027 (USD Billion)
- Figure 67: Germany Liquid Packaging Market- By Packaging Format, By Value (USD Billion), 2017-2027
- Figure 68: Germany Liquid Packaging Market - By Technology, By Value (USD Billion), 2017-2027
- Figure 69: Germany Liquid Packaging Market - By Material, By Value (USD Billion), 2017-2027
- Figure 70: Germany Liquid Packaging Market - By End Use Industry, By Value (USD Billion), 2017-2027
- Figure 71: France distribution of corrugated cardboard sales, (in %), 2019
- Figure 72: France client market of corrugated cardboard packaging, (in %), 2019
- Figure 73: France recovered paper market, in million metric tons, 2019
- Figure 74: France packaging market in million metric tons, 2019
- Figure 75: France Liquid Packaging Market Size, By Value, 2017-2027 (USD Billion)
- Figure 76: France Liquid Packaging Market- By Packaging Format, By Value (USD Billion), 2017-2027
- Figure 77: France Liquid Packaging Market - By Technology, By Value (USD Billion), 2017-2027
- Figure 78: France Liquid Packaging Market - By Material, By Value (USD Billion), 2017-2027
- Figure 79: France Liquid Packaging Market - By End Use Industry, By Value (USD Billion), 2017-2027
- Figure 80: United Kingdom trade of paper and paperboard, 2019, (million metric tons)
- Figure 81: United Kingdom recovered paper market, in million metric tons, 2019
- Figure 82: EU-UK exports of food and drinks, 2020, (in %)
- Figure 83: United Kingdom packaging market in million metric tons, 2019
- Figure 84: United Kingdom Liquid Packaging Market Size, By Value, 2017-2027 (USD Billion)
- Figure 85: United Kingdom Liquid Packaging Market- By Packaging Format, By Value (USD Billion), 2017-2027
- Figure 86: United Kingdom Liquid Packaging Market - By Technology, By Value (USD Billion), 2017-2027
- Figure 87: United Kingdom Liquid Packaging Market - By Material, By Value (USD Billion), 2017-2027
- Figure 88: United Kingdom Liquid Packaging Market - By End Use Industry, By Value (USD Billion), 2017-2027
- Figure 89: Italy recovered paper market, in million metric tons, 2019
- Figure 90: Italy wood pulp market, in million metric tons, 2019
- Figure 91: Italy packaging market in million metric tons, 2019
- Figure 92: Italy Liquid Packaging Market Size, By Value, 2017-2027 (USD Billion)
- Figure 93: Italy Liquid Packaging Market- By Packaging Format, By Value (USD Billion), 2017-2027
- Figure 94: Italy Liquid Packaging Market - By Technology, By Value (USD Billion), 2017-2027
- Figure 95: Italy Liquid Packaging Market - By Material, By Value (USD Billion), 2017-2027
- Figure 96: Italy Liquid Packaging Market - By End Use Industry, By Value (USD Billion), 2017-2027
- Figure 97: Regional share of shipment of corrugated packaging production by Asia Pacific, 2018
- Figure 98: Asia Pacific production, in million metric tons, 2019
- Figure 99: Asia Pacific share of exports of Agri-food to European Union, 2019
- Figure 100: Asia Pacific corrugated packaging production, in million metric tons, 2019
- Figure 101: Asia Pacific Liquid Packaging Market Size, By Value, 2017-2027 (USD Billion)
- Figure 102: APAC Liquid Packaging Market- By Packaging Format, By Value (USD Billion), 2017-2027
- Figure 103: APAC Liquid Packaging Market - By Technology, By Value (USD Billion), 2017-2027
- Figure 104: APAC Liquid Packaging Market - By Material, By Value (USD Billion), 2017-2027
- Figure 105: APAC Liquid Packaging Market - By End Use Industry, By Value (USD Billion), 2017-2027
- Figure 106: Market Opportunity Chart of APAC Liquid Packaging Market- By Country, By Value (Year-2031)
- Figure 107: APAC Liquid Packaging Market- By Country Market Share, 2021 & 2027
- Figure 108: China, Pharmaceuticals Market Value (USD Billion), 2016 & 2021
- Figure 109: China food and beverages export destinations, (in %), 2020
- Figure 110: China food and beverages production segment, (in %), 2190
- Figure 111: China packaging market in million metric tons, 2019
- Figure 112: China Liquid Packaging Market Size, By Value, 2017-2027 (USD Billion)
- Figure 113: China Liquid Packaging Market- By Packaging Format, By Value (USD Billion), 2017-2027
- Figure 114: China Liquid Packaging Market - By Technology, By Value (USD Billion), 2017-2027
- Figure 115: China Liquid Packaging Market - By Material, By Value (USD Billion), 2017-2027
- Figure 116: China Liquid Packaging Market - By End Use Industry, By Value (USD Billion), 2017-2027
- Figure 117: India recovered paper market, in million metric tons, 2019
- Figure 118: India food and beverages top export destinations, (in %), 2019-20
- Figure 119: India food and beverages production segment, (in %), 2019
- Figure 120: India number of annual online shoppers, in millions, 2018-2020
- Figure 121: India Liquid Packaging Market Size, By Value, 2017-2027 (USD Billion)
- Figure 122: India Liquid Packaging Market- By Packaging Format, By Value (USD Billion), 2017-2027
- Figure 123: India Liquid Packaging Market - By Technology, By Value (USD Billion), 2017-2027
- Figure 124: India Liquid Packaging Market - By Material, By Value (USD Billion), 2017-2027
- Figure 125: India Liquid Packaging Market - By End Use Industry, By Value (USD Billion), 2017-2027
- Figure 126: Japan recovered paper market, in million metric tons, 2019
- Figure 127: Japan wood pulp market, in million metric tons, 2019
- Figure 128: Japan packaging market in million metric tons, 2019
- Figure 129: Japan Liquid Packaging Market Size, By Value, 2017-2027 (USD Billion)
- Figure 130: Japan Liquid Packaging Market- By Packaging Format, By Value (USD Billion), 2017-2027
- Figure 131: Japan Liquid Packaging Market - By Technology, By Value (USD Billion), 2017-2027
- Figure 132: Japan Liquid Packaging Market - By Material, By Value (USD Billion), 2017-2027
- Figure 133: Japan Liquid Packaging Market - By End Use Industry, By Value (USD Billion), 2017-2027
- Figure 134: South Korea recovered paper market, in million metric tons, 2019
- Figure 135: South Korea value of processed food produced, (in USD Billions), 2016-2018
- Figure 136: South Korea packaging market in million metric tons, 2019
- Figure 137: South Korea Liquid Packaging Market Size, By Value, 2017-2027 (USD Billion)
- Figure 138: South Korea Liquid Packaging Market- By Packaging Format, By Value (USD Billion), 2017-2027
- Figure 139: South Korea Liquid Packaging Market - By Technology, By Value (USD Billion), 2017-2027
- Figure 140: South Korea Liquid Packaging Market - By Material, By Value (USD Billion), 2017-2027
- Figure 141: South Korea Liquid Packaging Market - By End Use Industry, By Value (USD Billion), 2017-2027
- Figure 142: Latin America and Middle East & Africa Liquid Packaging Market Size, By Value, 2017-2027 (USD Billion)
- Figure 143: Market Attractiveness Chart of Global Liquid Packaging Market- By Packaging Format (Year-2027)
- Figure 144: Market Attractiveness Chart of Global Liquid Packaging Market- By Technology (Year-2027)
- Figure 145: Market Attractiveness Chart of Global Liquid Packaging Market- By Material (Year-2027)
- Figure 146: Market Attractiveness Chart of Global Liquid Packaging Market- BY End Use Industry (Year-2027)
- Figure 147: Market Attractiveness Chart of Global Liquid Packaging Market- By Region (Year-2027)
- Figure 148: Global leading Liquid Packaging Companies Market Share (%), 2021
- Figure 149: Oji Holdings Corporation Annual Sales Revenue, 2017-2021 (USD Billion)
- Figure 150: Oji Holdings Corporation Net Income, 2017-2021 (USD Billion)
- Figure 151: Oji Holdings Corporation Sales Revenue, By Business Sector (%), FY2020
- Figure 152: Oji Holdings Corporation Sales Revenue, By Business Sector (%), FY2019
- Figure 153: International Paper Company Annual Sales Revenue, 2017-2020 (USD Billion)
- Figure 154: International Paper Company Net Income, 2017-2020 (USD Billion)
- Figure 155: International Paper Company Sales Revenue, By Business Segment (%), FY2020
- Figure 156: International Paper Company Sales Revenue, By Geographical Segment (%), FY2020
- Figure 157: West Rock Company Annual Sales Revenue, 2017-2021 (USD Billion)
- Figure 158: West Rock Company Net Income, 2017-2021 (USD Billion)
- Figure 159: West Rock Company Sales Revenue, By Business Segment (%), FY2021
- Figure 160: West Rock Company Sales Revenue, By Geographical Segment (%), FY2021
- Figure 161: Dow Chemical Company Annual Sales Revenue, 2017-2020 (USD Billion)
- Figure 162: Dow Chemical Company Net Income, 2017-2020 (USD Billion)
- Figure 163: Dow Chemical Company Net Sales Revenue, By Business Segment (%), 2020
- Figure 164: Dow Chemical Company Net Sales Revenue, By Geographic Segment (%), 2020
- Figure 165: Mondi Sales Revenue (USD Billion), 2017-2021
- Figure 166: Mondi Profit (USD Billion), 2017-2021
- Figure 167: Mondi Revenue By Business Segment (%), FY2021
- Figure 168: Mondi Sales Revenue Split, By Geography Segment (%), FY2021
- Figure 169: Smurfit Kappa Sales Revenue (USD Billion), 2017-2021
- Figure 170: Smurfit Kappa Net Profit (USD Billion), 2017-2021
- Figure 171: Smurfit Kappa Sales Revenue, By Product (%), 2021
- Figure 172: Smurfit Kappa Sales Revenue, By Geographic Segment (%), 2021
- Figure 173: Amcor plc., Annual Net Sales Revenue, 2018-2021 (USD Billion)
- Figure 174: Amcor plc., Net Income, 2018-2021 (USD Billion)
- Figure 175: Amcor plc., Net Sales, By Business Segments (%), FY2021
- Figure 176: Amcor plc., Net Sales, By Geographical Segment (%), FY2021
- Figure 177: ELOPAK Annual Sales Revenue, 2019-2021 (USD Billion)
- Figure 178: ELOPAK Profit, 2019-2021 (USD Billion)
- Figure 179: ELOPAK Net Sales, By Business Segments (%), FY2021
- Figure 180: ELOPAK Net Sales, By Geographic Segment (%), FY2021
- Figure 181: Billerudkorsnas Annual Sales Revenue, 2017-2021 (USD Billion)
- Figure 182: Billerudkorsnas Profit, 2017-2021 (USD Billion)
- Figure 183: Billerudkorsnas Sales, By Business Segment (%), FY2021
- Figure 184: Billerudkorsnas Sales, By Geographical Segment (%), FY2021
Executive Summary
The global liquid packaging market is valued at USD 313 Billion in the year 2021 and is projected to display significant growth with the Asia Pacific leading the regional market share.
The Covid-19 pandemic had a negative impact on the liquid packaging business. The industrial liquid packaging industry suffered as the manufacturing sector declined. The tourism industry has been impacted by the lockdown, as have the food and beverage and hotel industries.
After March 2020, demand for sanitiser, hand washes, and liquid detergents has skyrocketed in an effort to stop the spread of the COVID-19-causing virus. The need for sanitiser bottles, containers, and stand-up pouches has surged as a result. Furthermore, it raised the demand for top handle and side handle containers for chemical storage, such as Sodium Hypochlorite, a common disinfectant.
Improved disposable income and changing lifestyles have influenced consumption patterns, resulting in increased demand for packaged beverages and other FMCG products. E-commerce platforms also cater to all liquid-packaged consumer goods. Personal care, cosmetics, over-the-counter medications, topical solutions, and household care products are all included.
Scope of the Report
- The report presents the analysis of the Global Liquid Packaging Market for the historical period of 2017-2021 and the forecast period of 2022-2027.
- The report analyses the Global Liquid Packaging Market by Value (USD Billion).
- The report analyses the Global Liquid Packaging Market by Packaging Format (Rigid and Flexible).
- The report analyses the Global Liquid Packaging Market by Technology (Aseptic Liquid Packaging, Blow Molding, Form Fill Seal)
- The report analyses the Global Liquid Packaging Market by Material (Paper, Plastic, Glass, Metal, and Others).
- The report analyses the Global Liquid Packaging Market by End-Use Industry (Food & Beverages, Pharmaceuticals, Personal care, Others).
- The Global Liquid Packaging Market has been analysed By Region (North America, Europe, Asia Pacific, LAMEA) and By Country (United States, Canada, United Kingdom, Germany, France, Italy, China, India, Japan, South Korea).
- The key insights of the report have been presented through the frameworks of the attractiveness of the market has been presented by region, Packaging Format, technology, material, and by end-use industry.
- Also, the major opportunities, trends, drivers and challenges of the industry have been analysed in the report.
- The report tracks competitive developments, strategies, mergers and acquisitions and new product development. The companies analysed in the report include Tetra Pak, International Paper, West Rock Company, Oji Holdings Corporation, Dow Chemical Company, Mondi PLC., Smurfit Kappa, Amcor plc. Elopak, and Billerudkorsnas AB.
Key Target Audience
- Packaging Companies
- Consulting and Advisory Firms
- Government and Policy Makers
- Regulatory Authorities
Table of Contents
1. Report Scope and Methodology
- 1.1 Scope of the Report
- 1.2 Research Methodology
- 1.3 Executive Summary
2. Strategic Recommendations
3. Global Liquid Packaging Market: Product Overview
4. Global Liquid Packaging Market: An Analysis
- 4.1 Market Size, By Value, 2017-2027
- 4.2 Global Liquid Packaging Market: Growth & Forecast
- 4.3 Impact of COVID-19 on Liquid Packaging Market
5. Global Liquid Packaging Market By Packaging Format
- 5.1 Competitive Scenario of Global Liquid Packaging Market: By Packaging Format (2021 & 2027)
- 5.2 By Rigid - Market Size and Forecast (2017-2027)
- 5.3 By Flexible - Market Size and Forecast (2017-2027)
6. Global Liquid Packaging Market Segmentation, By Technology (Value)
- 6.1 Competitive Scenario of Global Liquid Packaging Market: By Technology (2021 & 2027)
- 6.2 By Aseptic Liquid Packaging - Market Size and Forecast (2017-2027)
- 6.3 By Blow Molding - Market Size and Forecast (2017-2027)
- 6.4 By Form Fill Seal - Market Size and Forecast (2017-2027)
7. Global Liquid Packaging Market Segmentation, By Material (Value)
- 7.1 Competitive Scenario of Global Liquid Packaging Market: By Material (2021 & 2027)
- 7.2 By Paper - Market Size and Forecast (2017-2027)
- 7.3 By Plastic - Market Size and Forecast (2017-2027)
- 7.4 By Glass - Market Size and Forecast (2017-2027)
- 7.5 By Metal - Market Size and Forecast (2017-2027)
- 7.6 By Others - Market Size and Forecast (2017-2027)
8. Global Liquid Packaging Market Segmentation, By End-Use Industry (Value)
- 8.1 Competitive Scenario of Global Liquid Packaging Market: By End-Use Industry (2021 & 2027)
- 8.2 By Food and Beverages - Market Size and Forecast (2017-2027)
- 8.3 By Personal Care - Market Size and Forecast (2017-2027)
- 8.4 By Pharmaceuticals - Market Size and Forecast (2017-2027)
- 8.5 By Others - Market Size and Forecast (2017-2027)
9. Global Liquid Packaging Market: Regional Analysis
- 9.1 Competitive Scenario of Global Liquid Packaging Market: By Region (2021 & 2027)
10 North America Liquid Packaging Market: An Analysis (2017-2027)
- 10.1 North America Liquid Packaging Market by value: Size and Forecast (2017-2027)
- 10.2 North America Liquid Packaging Market: Prominent Companies
- 10.3 Market Segmentation By Packaging Format (Rigid, Flexible)
- 10.4 Market Segmentation By Technology (Aseptic Liquid Packaging, Blow Molding, Form Fill Seal)
- 10.5 Market Segmentation By Material (Paper, Plastic, Glass, Metal, Others.)
- 10.6 Market Segmentation By End Use Industry (Food & Beverages, Personal Care, Pharmaceuticals, Others)
- 10.7 North America Liquid Packaging Market: Country Analysis
- 10.8 Market Opportunity Chart of North America Liquid Packaging Market - By Country, By Value (Year-2027)
- 10.9 Competitive Scenario of North America Liquid Packaging Market - By Country (2021 & 2027)
- 10.10 United States Liquid Packaging Market: Size and Forecast (2017-2027)
- 10.11 United States Liquid Packaging Market Segmentation By Packaging Format, By Technology, By Material, By End Use Industry (2017-2027)
- 10.12 Canada Liquid Packaging Market: Size and Forecast (2017-2027)
- 10.13 Canada Liquid Packaging Market Segmentation By Packaging Format, By Technology, By Material, By End Use Industry (2017-2027)
11. Europe Liquid Packaging Market: An Analysis (2017-2027)
- 11.1 Europe Liquid Packaging Market by value: Size and Forecast (2017-2027)
- 11.2 Europe Liquid Packaging Market: Prominent Companies
- 11.3 Market Segmentation By Packaging Format (Rigid, Flexible)
- 11.4 Market Segmentation By Technology (Aseptic Liquid Packaging, Blow Molding, Form Fill Seal)
- 11.5 Market Segmentation By Material (Paper, Plastic, Glass, Metal, Others.)
- 11.6 Market Segmentation By End Use Industry (Food & Beverages, Personal Care, Pharmaceuticals, Others)
- 11.7 Europe Liquid Packaging Market: Country Analysis
- 11.8 Market Opportunity Chart of Europe Liquid Packaging Market - By Country, By Value (Year-2027)
- 11.9 Competitive Scenario of Europe Liquid Packaging Market - By Country (2021 & 2027)
- 11.10 Germany Liquid Packaging Market: Size and Forecast (2017-2027)
- 11.11 Germany Liquid Packaging Market Segmentation By Packaging Format, By Technology, By Material, By End Use Industry (2017-2027)
- 11.12 France Liquid Packaging Market: Size and Forecast (2017-2027)
- 11.13 France Liquid Packaging Market Segmentation By Packaging Format, By Technology, By Material, By End Use Industry (2017-2027)
- 11.14 United Kingdom Liquid Packaging Market: Size and Forecast (2017-2027)
- 11.15 United Kingdom Liquid Packaging Market Segmentation By Packaging Format, By Technology, By Material, By End Use Industry (2017-2027)
- 11.16 Italy Liquid Packaging Market: Size and Forecast (2017-2027)
- 11.17 Italy Liquid Packaging Market Segmentation By Packaging Format, By Technology, By Material, By End Use Industry (2017-2027)
12. Asia Pacific Liquid Packaging Market: An Analysis (2017-2027)
- 12.1 Asia Pacific Liquid Packaging Market by value: Size and Forecast (2017-2027)
- 12.2 Asia Pacific Liquid Packaging Market: Prominent Companies
- 12.3 Market Segmentation By Packaging Format (Rigid, Flexible)
- 12.4 Market Segmentation By Technology (Aseptic Liquid Packaging, Blow Molding, Form Fill Seal)
- 12.5 Market Segmentation By Material (Paper, Plastic, Glass, Metal, Others.)
- 12.6 Market Segmentation By End-Use Industry (Food & Beverages, Personal Care, Pharmaceuticals, Others)
- 12.7 Asia Pacific Liquid Packaging Market: Country Analysis
- 12.8 Market Opportunity Chart of Asia Pacific Liquid Packaging Market - By Country, By Value (Year-2027)
- 12.9 Competitive Scenario of Asia Pacific Liquid Packaging Market - By Country (2021 & 2027)
- 12.10 China Liquid Packaging Market: Size and Forecast (2017-2027)
- 12.11 China Liquid Packaging Market Segmentation By Packaging Format, By Technology, By Material, By End Use Industry (2017-2027)
- 12.12 India Liquid Packaging Market: Size and Forecast (2017-2027)
- 12.13 India Liquid Packaging Market Segmentation By Packaging Format, By Technology, By Material, By End Use Industry (2017-2027)
- 12.14 Japan Liquid Packaging Market: Size and Forecast (2017-2027)
- 12.15 Japan Liquid Packaging Market Segmentation By Packaging Format, By Technology, By Material, By End Use Industry (2017-2027)
- 12.16 South Korea Liquid Packaging Market: Size and Forecast (2017-2027)
- 12.17 South Korea Liquid Packaging Market Segmentation By Packaging Format, By Technology, By Material, By End Use Industry (2017-2027)
13. LAMEA Liquid Packaging Market
- 13.1 LAMEA Liquid Packaging Market by value: Size and Forecast (2017-2027)
14. Global Liquid Packaging Market Dynamics
- 14.1 Global Liquid Packaging Market Drivers
- 14.2 Global Liquid Packaging Market Restraints
- 14.3 Global Liquid Packaging Market Trends
15. Market Attractiveness
- 15.1 Market Attractiveness Chart of Global Liquid Packaging Market - By Packaging Format (Year 2027)
- 15.2 Market Attractiveness Chart of Global Liquid Packaging Market - By Technology (Year 2027)
- 15.3 Market Attractiveness Chart of Global Liquid Packaging Market - By Material (Year 2027)
- 15.4 Market Attractiveness Chart of Global Liquid Packaging Market - By End Use Industry (Year 2027)
- 15.5 Market Attractiveness Chart of Global Liquid Packaging Market - By Region (Year 2027)
16. Competitive Landscape
- 16.1 Market Share of global leading companies
- 16.2 Porter Five Force Analysis - Global Liquid Packaging Market
17. Major Technological Innovations, Mergers & Acquisitions and Role of Manufacturers
18. Company Profiles (Business Description, Financial Analysis, Business Strategy)
- 18.1 Tetra Pak
- 18.2 Oji Holdings Corporation
- 18.3 International Paper Company
- 18.4 West Rock Company
- 18.5 Dow Chemical Company
- 18.6 Mondi Plc.
- 18.7 Smurfit Kappa
- 18.8 Amcor plc.
- 18.9 ELOPAK
- 18.10 Billerudkorsnas