|
|
市場調査レポート
商品コード
1082038
希少疾患治療薬の世界市場(2022年)- 薬剤タイプ別、治療分野別、患者別、投与経路別、流通チャネル別、地域別、国別分析(2022年):市場洞察、COVID-19の影響と予測(2022年~2027年)Global Rare Disease Drugs Market (2022 Edition) - Analysis By Drug Type, Therapeutic Area, Patients, Route of Administration, Distribution Channel, By Region, By Country (2022 Edition): Market Insights, and Forecast with Impact of COVID-19 (2022-2027) |
||||||
|
|
|||||||


| 希少疾患治療薬の世界市場(2022年)- 薬剤タイプ別、治療分野別、患者別、投与経路別、流通チャネル別、地域別、国別分析(2022年):市場洞察、COVID-19の影響と予測(2022年~2027年) |
|
出版日: 2022年05月31日
発行: Azoth Analytics
ページ情報: 英文 290 Pages
納期: 即納可能
|
- 全表示
- 概要
- 図表
- 目次
世界の希少疾患治療薬の市場規模は、2021年に1,471億2,000万米ドルとなりました。研究活動や新規治療薬の開発への注目が高まっていることが、同市場の成長を促進しています。また、製品開発の活発化により、希少遺伝性疾患の診断に技術主導の革新的なデバイスの導入が進んでいます。
当レポートでは、世界の希少疾患治療薬市場について調査し、市場の概要とともに、薬剤タイプ別、治療分野別、患者別、投与経路別、流通チャネル別、地域別の動向、および市場に参入する企業のプロファイルなどを提供しています。目次
第1章 調査範囲と調査手法
第2章 戦略的推奨事項
第3章 希少疾患治療薬市場:製品の見通し
第4章 世界の希少疾患治療薬市場:規模と予測
第5章 世界の希少疾患治療薬市場のセグメンテーション-薬剤タイプ別、治療分野別、患者別、投与経路別、流通チャネル別
- 世界の希少疾患治療薬市場の競合シナリオ:薬剤タイプ別
- 生物製剤-市場規模および予測(2017年~2027年)
- 非生物製剤-市場規模および予測(2017年~2027年)
- 世界の希少疾患治療薬市場の競合シナリオ:治療分野別
- 感染症-市場規模および予測(2017年~2027年)
- 腫瘍学-市場規模および予測(2017年~2027年)
- 神経学-市場規模および予測(2017年~2027年)
- 代謝-市場規模および予測(2017年~2027年)
- その他-市場規模および予測(2017年~2027年)
- 世界の希少疾患治療薬市場の競合シナリオ:患者別
- 小児-市場規模および予測(2017年~2027年)
- 大人-市場規模および予測(2017年~2027年)
- 世界の希少疾患治療薬市場の競合シナリオ:投与経路別
- 経口-市場規模および予測(2017年~2027年)
- 注射-市場規模および予測(2017年~2027年)
- 世界の希少疾患治療薬市場の競合シナリオ:流通チャネル別
- 院内薬局・小売薬局-市場規模および予測(2017年~2027年)
- オンライン薬局-市場規模および予測(2017年~2027年)
第6章 世界の希少疾患治療薬市場:地域分析
- 世界の希少疾患治療薬市場の競合シナリオ:地域別
第7章 北米の希少疾患治療薬市場:分析(2017年~2027年)
第8章 欧州の希少疾患治療薬市場:分析(2017年~2027年)
第9章 アジア太平洋の希少疾患治療薬市場:分析(2017年~2027年)
第10章 世界の希少疾患治療薬市場力学
第11章 市場の魅力
第12章 競合情勢
- 市場シェア分析
第13章 企業の分析
- Takeda Pharmaceutical Company Limited
- Sanofi
- Merck KGaA
- F. Hoffman-La Roche Ltd.
- Pfizer
- Novartis AG
- Bayer Group
- Biogen
- GlaxoSmithKline
- AbbVie Inc.
List of Figures
List of Figures
- Figure 1: Global Rare Disease Drugs Market Size, By Value, 2017-2027 (USD Billion)
- Figure 2: Global Prevalence of Neurological Disorders, 2015-2019 (In Billions)
- Figure 3: Global Prevalence of Cardiovascular Diseases, 2015-2019 (In Millions)
- Figure 4: Global Prevalence of Total Cancer, 2015-2019 (In Millions)
- Figure 5: Prevalence of Rare Disease Drugss in the U.S., EU, and estimated prevalence in China, (In Million)2021
- Figure 6: World's leading causes of death (in millions), 2018
- Figure 7: World Population 65 Years & Above (% of Total), 2015-2019
- Figure 8: Global Current Healthcare Expenditure as % of GDP, 2015-2018 (In %)
- Figure 9: Global Rare Disease Drugs - Clinical Trial
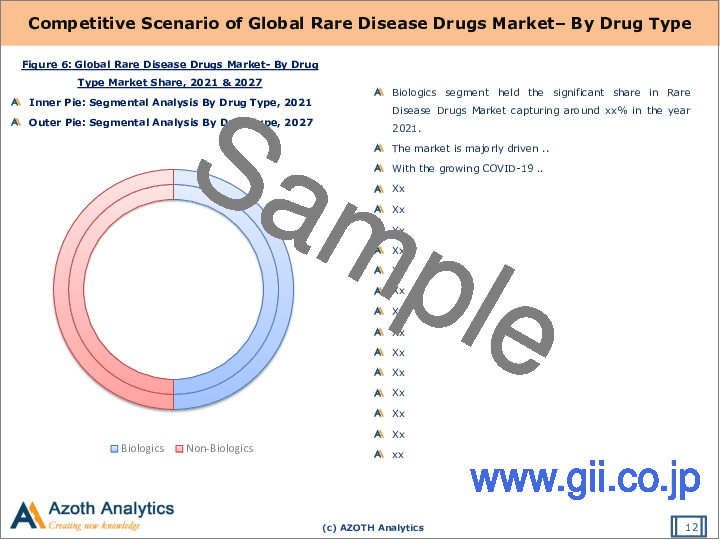
- Figure 10: Global Rare Disease Drugs Market- By Drug Type Market Share, 2021 & 2027
- Figure 11: Global Rare Disease Drugs Market- By Biologics, By Value (USD Billion), 2017-2027
- Figure 12: Global Rare Disease Drugs Market- By Non-Biologics, By Value (USD Billion), 2017-2027
- Figure 13: Global Rare Disease Drugs Market- By Therapeutic Area Market Share, 2021 & 2027
- Figure 14: Global Rare Disease Drugs Market- By Infectious Disease, By Value (USD Billion), 2017-2027
- Figure 15: Global Rare Disease Drugs Market- By Oncology, By Value (USD Billion), 2017-2027
- Figure 16: Global Rare Disease Drugs Market- By Neurological, By Value (USD Billion), 2017-2027
- Figure 17: Global Rare Disease Drugs Market- By Metabolic, By Value (USD Billion), 2017-2027
- Figure 18: Global Rare Disease Drugs Market- By Others, By Value (USD Billion), 2017-2027
- Figure 19: Global Rare Disease Drugs Market- By patients Market Share, 2021 & 2027
- Figure 20: Global Rare Disease Drugs Market- By Pediatric, By Value (USD Billion), 2017-2027
- Figure 21: Global Rare Disease Drugs Market- By Adults, By Value (USD Billion), 2017-2027
- Figure 22: Global Rare Disease Drugs Market- By Route of Administration Market Share, 2021 & 2027
- Figure 23: Global Rare Disease Drugs Market- By Oral, By Value (USD Billion), 2017-2027
- Figure 24: Global Rare Disease Drugs Market- By Injectable, By Value (USD Billion), 2017-2027
- Figure 25: Global Rare Disease Drugs Market- By Distribution Channel Market Share, 2021 & 2027
- Figure 26: Global Rare Disease Drugs Market- By Hospital & Retail Pharmacies, By Value (USD Billion), 2017-2027
- Figure 27: Global Rare Disease Drugs Market- By Online Pharmacies, By Value (USD Billion), 2017-2027
- Figure 28: Global Rare Disease Drugs Market- By Region Market Share, 2021 & 2027
- Figure 29: North America Rare Disease Drugs Market Size, By Value, 2017-2027 (USD Billion)
- Figure 30: North America Prevalence of Neurological Disorders, 2015-2019 (In Millions)
- Figure 31: North America Prevalence of Cardiovascular Diseases, 2015-2019 (In Millions)
- Figure 32: North America Prevalence of Total Cancer, 2015-2019 (In Millions)
- Figure 33: North America Population ages 65 and above (% of total Population), 2016-2020
- Figure 34: North America Current Healthcare Expenditure as % of GDP, 2015-2018 (In %)
- Figure 35: North America Rare Disease Drugs Market - By Drug Type, By Value (USD Billion), 2017-2027
- Figure 36: North America Rare Disease Drugs Market - By Therapeutic Area, By Value (USD Billion), 2017-2027
- Figure 37: North America Rare Disease Drugs Market - By Patients, By Value (USD Billion), 2017-2027
- Figure 38: North America Rare Disease Drugs Market - By Route of Administration, By Value (USD Billion), 2017-2027
- Figure 39: North America Rare Disease Drugs Market - By Distribution Channel, By Value (USD Billion), 2017-2027
- Figure 40: Market Opportunity Chart of North America Rare Disease Drugs Market- By Country, By Value (Year-2027)
- Figure 41: North America Rare Disease Drugs Market- By Country Market Share, 2021 & 2027
- Figure 42: United States Rare Disease Drugs Market Size, By Value, 2017-2027 (USD Billion)
- Figure 43: United State Prevalence of Neurological Disorders, 2015-2019 (In Millions)
- Figure 44: United State Prevalence of Cardiovascular Diseases, 2015-2019 (In Millions)
- Figure 45: United State Prevalence of Total Cancer, 2015-2019 (In Millions)
- Figure 46: United States Population aged 65 and above (% of total Population), 2016-2020
- Figure 47: United State Current Healthcare Expenditure as % of GDP, 2015-2018 (In %)
- Figure 48: United State National Institute of Health Spending on Rare Disease Drugs, ( USD Million), 2016-2020
- Figure 49: Median U.S. cost per patient per year for top 100 products, 2015-2018
- Figure 50: United States Rare Disease Drugs Market - By Drug Type, By Value (USD Billion), 2017-2027
- Figure 51: United States Rare Disease Drugs Market - By Therapeutic Area, By Value (USD Billion), 2017-2027
- Figure 52: United States Rare Disease Drugs Market - By Patients, By Value (USD Billion), 2017-2027
- Figure 53: United States Rare Disease Drugs Market - By Route of Administration, By Value (USD Billion), 2017-2027
- Figure 54: United States Rare Disease Drugs Market - By Distribution Channel, By Value (USD Billion), 2017-2027
- Figure 55: Canada Rare Disease Drugs Market Size, By Value, 2017-2027 (USD Billion)
- Figure 56: Canada Prevalence of Neurological Disorders, 2015-2019 (In Millions)
- Figure 57: Canada Prevalence of Cardiovascular Diseases, 2015-2019 (In Millions)
- Figure 58: Canada Prevalence of Total Cancer, 2015-2019 (In Millions)
- Figure 59: Canada Population aged 65 and above (% of total Population), 2016-2020
- Figure 60: Canada Current Healthcare Expenditure as % of GDP, 2015-2018 (In %)
- Figure 61: Canada Rare Disease Drugs Market - By Drug Type, By Value (USD Billion), 2017-2027
- Figure 62: Canada Rare Disease Drugs Market - By Therapeutic Area, By Value (USD Billion), 2017-2027
- Figure 63: Canada Rare Disease Drugs Market - By Patients, By Value (USD Billion), 2017-2027
- Figure 64: Canada Rare Disease Drugs Market - By Route of Administration, By Value (USD Billion), 2017-2027
- Figure 65: Canada Rare Disease Drugs Market - By Distribution Channel, By Value (USD Billion), 2017-2027
- Figure 66: Europe Rare Disease Drugs Market Size, By Value, 2017-2027 (USD Billion)
- Figure 67: Europe Prevalence of Neurological Disorders, 2015-2019 (In Millions)
- Figure 68: Europe Prevalence of Cardiovascular Diseases, 2015-2019 (In Millions)
- Figure 69: Europe Prevalence of Total Cancer, 2015-2019 (In Millions)
- Figure 70: European Countries Population ages 65 and above (% of total Population), 2020
- Figure 71: Europe Current Healthcare Expenditure as % of GDP, 2015-2018 (In %)
- Figure 72: Europe Rare Disease Drugs Market - By Drug Type, By Value (USD Billion), 2017-2027
- Figure 73: Europe Rare Disease Drugs Market - By Therapeutic Area, By Value (USD Billion), 2017-2027
- Figure 74: Europe Rare Disease Drugs Market - By Patients, By Value (USD Billion), 2017-2027
- Figure 75: Europe Rare Disease Drugs Market - By Route of Administration, By Value (USD Billion), 2017-2027
- Figure 76: Europe Rare Disease Drugs Market - By Distribution Channel, By Value (USD Billion), 2017-2027
- Figure 77: Market Opportunity Chart of Europe Rare Disease Drugs Market- By Country, By Value (Year -2027)
- Figure 78: Europe Rare Disease Drugs Market- By Country Market Share, 2021 & 2027
- Figure 79: Germany Rare Disease Drugs Market Size, By Value, 2017-2027 (USD Billion)
- Figure 80: Germany Prevalence of Neurological Disorders, 2015-2019 (In Millions)
- Figure 81: Germany Prevalence of Cardiovascular Diseases, 2015-2019 (In Millions)
- Figure 82: Germany Prevalence of Total Cancer, 2015-2019 (In Millions)
- Figure 83: Germany Current Healthcare Expenditure Per Capita, 2015-2018 (In Numbers)
- Figure 84: Germany Current Healthcare Expenditure as % of GDP, 2015-2018 (In %)
- Figure 85: Germany Rare Disease Drugs Market - By Drug Type, By Value (USD Billion), 2017-2027
- Figure 86: Germany Rare Disease Drugs Market - By Therapeutic Area, By Value (USD Billion), 2017-2027
- Figure 87: Germany Rare Disease Drugs Market - By Patients, By Value (USD Billion), 2017-2027
- Figure 88: Germany Rare Disease Drugs Market - By Route of Administration, By Value (USD Billion), 2017-2027
- Figure 89: Germany Rare Disease Drugs Market - By Distribution Channel, By Value (USD Billion), 2017-2027
- Figure 90: United Kingdom Rare Disease Drugs Market Size, By Value, 2017-2027 (USD Billion)
- Figure 91: United Kingdom Prevalence of Neurological Disorders, 2015-2019 (In Millions)
- Figure 92: United Kingdom Prevalence of Cardiovascular Diseases, 2015-2019 (In Millions)
- Figure 93: United Kingdom Prevalence of Total Cancer, 2015-2019 (In Millions)
- Figure 94: United Kingdom Population ages 65 and above (% of total Population), 2016-20
- Figure 95: United Kingdom Current Healthcare Expenditure as % of GDP, 2015-2018 (In %)
- Figure 96: United Kingdom Rare Disease Drugs Market - By Drug Type, By Value (USD Billion), 2017-2027
- Figure 97: United Kingdom Rare Disease Drugs Market - By Therapeutic Area, By Value (USD Billion), 2017-2027
- Figure 98: United Kingdom Rare Disease Drugs Market - By Patients, By Value (USD Billion), 2017-2027
- Figure 99: United Kingdom Rare Disease Drugs Market - By Route of Administration, By Value (USD Billion), 2017-2027
- Figure 100: United Kingdom Rare Disease Drugs Market - By Distribution Channel, By Value (USD Billion), 2017-2027
- Figure 101: France Rare Disease Drugs Market Size, By Value, 2017-2027 (USD Billion)
- Figure 102: France Prevalence of Neurological Disorders, 2015-2019 (In Millions)
- Figure 103: France Prevalence of Cardiovascular Diseases, 2015-2019 (In Millions)
- Figure 104: France Prevalence of Total Cancer, 2015-2019 (In Millions)
- Figure 105: France Population ages 65 and above (% of total Population), 2016-20
- Figure 106: France Current Healthcare Expenditure as % of GDP, 2015-2018 (In %)
- Figure 107: France Rare Disease Drugs Market - By Drug Type, By Value (USD Billion), 2017-2027
- Figure 108: France Rare Disease Drugs Market - By Therapeutic Area, By Value (USD Billion), 2017-2027
- Figure 109: France Rare Disease Drugs Market - By Patients, By Value (USD Billion), 2017-2027
- Figure 110: France Rare Disease Drugs Market - By Route of Administration, By Value (USD Billion), 2017-2027
- Figure 111: France Rare Disease Drugs Market - By Distribution Channel, By Value (USD Billion), 2017-2027
- Figure 112: Italy Rare Disease Drugs Market Size, By Value, 2017-2027 (USD Billion)
- Figure 113: Italy Prevalence of Neurological Disorders, 2015-2019 (In Millions)
- Figure 114: Italy Prevalence of Cardiovascular Diseases, 2015-2019 (In Millions)
- Figure 115: Italy Prevalence of Total Cancer, 2015-2019 (In Millions)
- Figure 116: Italy Population ages 65 and above (% of total Population), 2016-20
- Figure 117: Italy Trend of expenditure for orphan drugs in Italy from 2016 to 2020 (In Euro USD)
- Figure 118: Italy Rare Disease Drugs Market - By Drug Type, By Value (USD Billion), 2017-2027
- Figure 119: Italy Rare Disease Drugs Market - By Therapeutic Area, By Value (USD Billion), 2017-2027
- Figure 120: Italy Rare Disease Drugs Market - By Patients, By Value (USD Billion), 2017-2027
- Figure 121: Italy Rare Disease Drugs Market - By Route of Administration, By Value (USD Billion), 2017-2027
- Figure 122: Italy Rare Disease Drugs Market - By Distribution Channel, By Value (USD Billion), 2017-2027
- Figure 123: Asia Pacific Rare Disease Drugs Market Size, By Value, 2017-2027 (USD Billion)
- Figure 124: Asia Pacific Prevalence of Neurological Disorders, 2015-2019 (In Millions)
- Figure 125: Asia Pacific Prevalence of Cardiovascular Diseases, 2015-2019 (In Millions)
- Figure 126: Asia Pacific Prevalence of Total Cancer, 2015-2019 (In Millions)
- Figure 127: Asia Pacific Population ages 65 and above, by Countries (% of total Population), 2020
- Figure 128: Asia Pacific Current Healthcare Expenditure as % of GDP, 2015-2018 (In %)
- Figure 129: Asia Pacific Rare Disease Drugs Market - By Drug Type, By Value (USD Billion), 2017-2027
- Figure 130: Asia Pacific Rare Disease Drugs Market - By Therapeutic Area, By Value (USD Billion), 2017-2027
- Figure 131: Asia Pacific Rare Disease Drugs Market - By Patients, By Value (USD Billion), 2017-2027
- Figure 132: Asia Pacific Rare Disease Drugs Market - By Route of Administration, By Value (USD Billion), 2017-2027
- Figure 133: Asia Pacific Rare Disease Drugs Market - By Distribution Channel, By Value (USD Billion), 2017-2027
- Figure 134: Market Opportunity Chart of APAC Rare Disease Drugs Market- By Country, By Value (Year -2027)
- Figure 135: APAC Rare Disease Drugs Market- By Country Market Share, 2021 & 2027
- Figure 136: China Rare Disease Drugs Market Size, By Value, 2017-2027 (USD Billion)
- Figure 137: China Prevalence of Neurological Disorders, 2015-2019 (In Millions)
- Figure 138: China Prevalence of Cardiovascular Diseases, 2015-2019 (In Millions)
- Figure 139: China Prevalence of Total Cancer, 2015-2019 (In Millions)
- Figure 140: China Population ages 65 and above, by Countries (% of total Population), 2020
- Figure 141: China Current Healthcare Expenditure as % of GDP, 2015-2018 (In %)
- Figure 142: China Rare Disease Drugs Market - By Drug Type, By Value (USD Billion), 2017-2027
- Figure 143: China Rare Disease Drugs Market - By Therapeutic Area, By Value (USD Billion), 2017-2027
- Figure 144: China Rare Disease Drugs Market - By Patients, By Value (USD Billion), 2017-2027
- Figure 145: China Rare Disease Drugs Market - By Route of Administration, By Value (USD Billion), 2017-2027
- Figure 146: China Rare Disease Drugs Market - By Distribution Channel, By Value (USD Billion), 2017-2027
- Figure 147: Japan Rare Disease Drugs Market Size, By Value, 2017-2027 (USD Billion)
- Figure 148: Japan Prevalence of Neurological Disorders, 2015-2019 (In Millions)
- Figure 149: Japan Prevalence of Cardiovascular Diseases, 2015-2019 (In Millions)
- Figure 150: Japan Prevalence of Total Cancer, 2015-2019 (In Millions)
- Figure 151: Japan Population ages 65 and above (% of total Population), 2016-20
- Figure 152: Japan Current Healthcare Expenditure as percentage of GDP, 2015-2018 (In %)
- Figure 153: Japan Rare Disease Drugs Market - By Drug Type, By Value (USD Billion), 2017-2027
- Figure 154: Japan Rare Disease Drugs Market - By Therapeutic Area, By Value (USD Billion), 2017-2027
- Figure 155: Japan Rare Disease Drugs Market - By Patients, By Value (USD Billion), 2017-2027
- Figure 156: Japan Rare Disease Drugs Market - By Route of Administration, By Value (USD Billion), 2017-2027
- Figure 157: Japan Rare Disease Drugs Market - By Distribution Channel, By Value (USD Billion), 2017-2027
- Figure 158: India Rare Disease Drugs Market Size, By Value, 2017-2027 (USD Billion)
- Figure 159: India Prevalence of Neurological Disorders, 2015-2019 (In Millions)
- Figure 160: India Prevalence of Cardiovascular Diseases, 2015-2019 (In Millions)
- Figure 161: India Prevalence of Total Cancer, 2015-2019 (In Millions)
- Figure 162: India Population ages 65 and above (% of total Population), 2016-20
- Figure 163: India Current Healthcare Expenditure as % of GDP, 2015-2018 (In %)
- Figure 164: India Current Healthcare Expenditure Per Capita, 2015-2018 (In Numbers)
- Figure 165: e-pharmacy market in India (USD Million)
- Figure 166: India Rare Disease Drugs Market - By Drug Type, By Value (USD Billion), 2017-2027
- Figure 167: India Rare Disease Drugs Market - By Therapeutic Area, By Value (USD Billion), 2017-2027
- Figure 168: India Rare Disease Drugs Market - By Patients, By Value (USD Billion), 2017-2027
- Figure 169: India Rare Disease Drugs Market - By Route of Administration, By Value (USD Billion), 2017-2027
- Figure 170: India Rare Disease Drugs Market - By Distribution Channel, By Value (USD Billion), 2017-2027
- Figure 171: South Korea Rare Disease Drugs Market Size, By Value, 2017-2027 (USD Billion)
- Figure 172: South Korea Prevalence of Neurological Disorders, 2015-2019 (In Millions)
- Figure 173: South Korea Prevalence of Cardiovascular Diseases, 2015-2019 (In Millions)
- Figure 174: South Korea Prevalence of Total Cancer, 2015-2019 (In Millions)
- Figure 175: South Korea Current Healthcare Expenditure Per Capita, 2015-2018 (In Numbers)
- Figure 176: South Korea Current Healthcare Expenditure as % of GDP, 2015-2018 (In %)
- Figure 177: South Korea Rare Disease Drugs Market - By Drug Type, By Value (USD Billion), 2017-2027
- Figure 178: South Korea Rare Disease Drugs Market - By Therapeutic Area, By Value (USD Billion), 2017-2027
- Figure 179: South Korea Rare Disease Drugs Market - By Patients, By Value (USD Billion), 2017-2027
- Figure 180: South Korea Rare Disease Drugs Market - By Route of Administration, By Value (USD Billion), 2017-2027
- Figure 181: South Korea Rare Disease Drugs Market - By Distribution Channel, By Value (USD Billion), 2017-2027
- Figure 182: Market Attractiveness Chart of Global Rare Disease Drugs Market- By Drug Type (Year -2027)
- Figure 183: Market Attractiveness Chart of Global Rare Disease Drugs Market- By Therapeutic Area (Year-2027)
- Figure 184: Market Attractiveness Chart of Global Rare Disease Drugs Market- By Patients(Year -2027)
- Figure 185: Market Attractiveness Chart of Global Rare Disease Drugs Market- By route of Administration (Year -2027)
- Figure 186: Market Attractiveness Chart of Global Rare Disease Drugs Market- By Distribution Channel (Year-2027)
- Figure 187: Market Attractiveness Chart of Global Rare Disease Drugs Market- By Region (Year -2027)
- Figure 188: Global Rare Disease Drugs company market share (%), 2020
- Figure 189: Takeda Pharmaceutical Company Limited Sales Revenues, 2016-2020 (USD Million)
- Figure 190: Takeda Pharmaceutical Company Limited Net Income, 2016-2020 (USD Million)
- Figure 191: Takeda Pharmaceutical Company Limited Sales Revenue Split, By Business Segment (%), FY2020
- Figure 192: Takeda Pharmaceutical Company Limited Sales Revenue Split, By Geography Segment (%), FY2020
- Figure 193: Sanofi Sales Revenues, 2016-2020 (USD Million)
- Figure 194: Sanofi Gross Profit, 2016-2020 (USD Million)
- Figure 195: Sanofi Sales Revenue Split, By Business Segment (%), FY2020
- Figure 196: Sanofi Sales Revenue Split, By Geography Segment (%), FY2020
- Figure 197: Merck KGaA Sales Revenues, 2016-2020 (USD Million)
- Figure 198: Merck KGaA Gross Profit, 2016-2020 (USD Million)
- Figure 199: Merck KGaA Sales Revenue Split, By Business Segment (%), FY2020
- Figure 200: Merck KGaA Sales Revenue Split, By Geography Segment (%), FY2020
- Figure 201: F. Hoffman-La Roche Ltd. Sales Revenues, 2016-2020 (USD Million)
- Figure 202: F. Hoffman-La Roche Ltd. Net Income, 2016-2020 (USD Million)
- Figure 203: F. Hoffman-La Roche Ltd. sales Revenues, By Business Segment (%), FY2020
- Figure 204: F. Hoffman-La Roche Ltd. sales Revenue, By Geographical Segment (%), FY2020
- Figure 205: Pfizer Annual Sales Revenue (USD Million), 2016-2020
- Figure 206: Pfizer Annual Net Income/Loss (USD Million), 2016-2020
- Figure 207: Pfizer sales Revenue, By Geographical Segment (%), FY2020
- Figure 208: Novartis Annual Sales Revenue (USD Million), 2016-2020
- Figure 209: Novartis Annual Net Income/Loss (USD Million), 2016-2020
- Figure 200: Novartis Sales Revenue Split, By Business Segment (USD Billion), FY2020
- Figure 211: Novartis Sales Revenue Split, By Geography Segment (%), FY2020
- Figure 212: Bayer Group Sales Revenues, 2016-2020 (USD Million)
- Figure 213: Bayer Group Net Profit, 2016-2020 (USD Million)
- Figure 214: Bayer Group, By Business Segment (%), FY2020
- Figure 215: Bayer Group, By Geographical Segment (%), FY2020
- Figure 216: Biogen Sales Revenues, 2016-2020 (USD Million)
- Figure 217: Biogen Net Profit, 2016-2020 (USD Million)
- Figure 218: Biogen, By Business Segment (%), FY2020
- Figure 219: Biogen, By Geographical Segment (%), FY2020
- Figure 220: GlaxoSmithKline Annual Sales Revenue (USD Million), 2016-2020
- Figure 221: GlaxoSmithKline Gross Profit (USD Million), 2016-2020
- Figure 222: GlaxoSmithKline Sales Revenue Split, By Business Segment (%), FY2020
- Figure 223: GlaxoSmithKline Sales Revenue Split, By Geography Segment (%), FY2020
- Figure 224: AbbVie Inc. Annual Sales Revenue (USD Million), 2016-2020
- Figure 225: AbbVie Inc. Net Income (USD Million), 2016-2020
- Figure 226: AbbVie Inc. Sales Revenue Split, By Business Segment (%), FY2020
- Figure 227: AbbVie Inc. Sales Revenue Split, By Geography Segment (%), FY2020
Executive Summary
According to Azoth Analytics research report, the Global Rare Disease Drugs was valued at USD 147.12 Billion in the year 2021. The increasing focus on research activities and the development of novel therapeutic drugs has facilitated the growth of the Rare Disease Drugs market. Additionally, growing product developments is leading to the implementation of technologically driven innovative devices in the diagnosis of rare genetic disorders.
Moreover, favourable government policies aiming at creating awareness pertaining to the Rare Disease treatment are leading to increased adoption of effective treatments of rare disorders. However, there are several factors hindering the efficient and effective clinical trials of drug development of rare disorders including low patient numbers, limited understanding of pathology and progression, and lack of established endpoints. Therefore, several regulatory bodies are engaged in implementing regulatory standards for drug approval for Rare diseases to ensure patient safety and efficacy of drugs.
Furthermore, improved detection and increased rates of diagnosis of Rare diseases are likely to contribute to rising costs. While the humanitarian benefits of Rare Disease therapies are indisputable, concerns regarding high treatment costs play a meaningful role in how payers administer and manage healthcare benefits that ultimately dictate patient access to orphan drugs. Moreover, the biological drugs are used for treating Rare diseases such as cancer with fewer side effects that have a high prevalence rate in the developed world.
Scope of the Report
- The report presents the analysis of the Rare Disease Drugs market for the historical period of 2017-2021 and the forecast period of 2022-2027.
- The report analyses the Rare Disease Drugs Market by Value (USD Billion).
- The report analyses the Rare Disease Drugs Market by Drug Type (Biologics, Non-Biologics).
- The report analyses the Rare Disease Drugs Market by Therapeutic Area (Infectious Disease, Oncology, Neurology, Metabolic, Others).
- The report analyses the Rare Disease Drugs Market by Patients (Pediatric, Adults).
- The report analyses the Rare Disease Drugs Market by Route of Administration (Oral, Injectable).
- The report analyses the Rare Disease Drugs Market by Distribution Channel (Hospital & Retail Pharmacies, Online Pharmacies).
- The Global Rare Disease Drugs Market has been analysed By Region (North America, Europe, Asia Pacific and LAMEA).
- The Global Rare Disease Drugs Market has been analysed By Country (United States, Canada, Germany, United Kingdom, France, Italy, China, Japan, India, South Korea).
- The attractiveness of the market has been presented by region, by Drug Type, by Therapeutic area, by patients, by Route of Administration and by Distribution Channel
- Also, the major opportunities, trends, drivers and challenges of the industry has been analysed in the report.
- The report tracks competitive developments, strategies, mergers and acquisitions and new product development.
- The companies analysed in the report include Takeda Pharmaceutical Company Limited, Sanofi, Merck KGaA, F. Hoffman-La Roche Ltd., Pfizer, Novartis AG, Bayer Group, Biogen, GlaxoSmithKline, AbbVie Inc.
Key Target Audience
- Rare Disease Drugs Manufacturers
- Healthcare and Pharmaceutical Companies
- Consulting and Advisory Firms
- Government and Policy Makers
- Regulatory Authorities
Table of Contents
1. Report Scope and Methodology
- 1.1 Scope of the Report
- 1.2 Research Methodology
- 1.3 Executive Summary
2. Strategic Recommendations
3. Rare Disease Drugs Market: Product Outlook
4. Global Rare Disease Drugs Market: Sizing and Forecast
- 4.1 Global Rare Disease Drugs Market Size, By Value, 2017-2027
- 4.2 Impact of COVID-19 on Global Rare Disease Drugs Market
5. Global Rare Disease Drugs Market Segmentation - By Drug Type, By Therapeutic Area, By Patients, By Route of Administration, By Distribution Channel
5.1 Competitive Scenario of Global Rare Disease Drugs Market: By Drug Type
- 5.1.1 Biologics - Market Size and Forecast (2017-2027)
- 5.1.2 Non-Biologics - Market Size and Forecast (2017-2027)
- 5.2 Competitive Scenario of Global Rare Disease Drugs Market: By Therapeutic Area
- 5.2.1 Infectious disease - Market Size and Forecast (2017-2027)
- 5.2.2 Oncology- Market Size and Forecast (2017-2027)
- 5.2.3 Neurological - Market Size and Forecast (2017-2027)
- 5.2.4 Metabolic - Market Size and Forecast (2017-2027)
- 5.2.5 Others - Market Size and Forecast (2017-2027)
- 5.3 Competitive Scenario of Global Rare Disease Drugs Market: By Patients
- 5.3.1 Paediatric - Market Size and Forecast (2017-2027)
- 5.3.2 Adults - Market Size and Forecast (2017-2027)
- 5.4 Competitive Scenario of Global Rare Disease Drugs Market: By Route of Administration
- 5.4.1 Oral - Market Size and Forecast (2017-2027)
- 5.4.2 Injectable - Market Size and Forecast (2017-2027)
- 5.5 Competitive Scenario of Global Rare Disease Drugs Market: By Distribution Channel
- 5.5.1 Hospitals & Retail Pharmacies- Market Size and Forecast (2017-2027)
- 5.5.2 Online Pharmacies - Market Size and Forecast (2017-2027)
6. Global Rare Disease Drugs Market: Regional Analysis
- 6.1 Competitive Scenario of Global Rare Disease Drugs Market: By Region
7. North America Rare Disease Drugs Market: An Analysis (2017-2027)
- 7.1 North America Rare Disease Drugs Market: Size and Forecast (2017-2027), By Value
- 7.2 North America Rare Disease Drugs Market - Prominent Companies
- 7.3 Market Segmentation By Drug Type (Biologics, Non-Biologics)
- 7.4 Market Segmentation By Therapeutic Area (Infectious Disease, Oncology, Neurological, Metabolic and Others)
- 7.5 Market Segmentation By Patients Type (Pediatric, Adults)
- 7.6 Market Segmentation By Route of Administration (Oral, Injectable)
- 7.7 Market Segmentation By Distribution Channel (Hospitals & Retail Pharmacies, Online Pharmacies)
- 7.8 North America Rare Disease Drugs Market: Country Analysis
- 7.9 Market Opportunity Chart of North America Rare Disease Drugs Market - By Country, By Value, 2027
- 7.10 Competitive Scenario of North America Rare Disease Drugs Market: By Country
- 7.11 United States Rare Disease Drugs Market: Size and Forecast (2017-2027), By Value
- 7.12 United States Rare Disease Drugs Market Segmentation - By Drug Type, By Therapeutic Area, By Patients, By Route of Administration, By Distribution Channel (2017-2027)
- 7.13 Canada Rare Disease Drugs Market: Size and Forecast (2017-2027), By Value
- 7.14 Canada Rare Disease Drugs Market Segmentation - By Drug Type, By Therapeutic Area, By Patients, By Route of Administration, By Distribution Channel (2017-2027)
8. Europe Rare Disease Drugs Market: An Analysis (2017-2027)
- 8.1 Europe Rare Disease Drugs Market: Size and Forecast (2017-2027), By Value
- 8.2 Europe Rare Disease Drugs Market - Prominent Companies
- 8.3 Market Segmentation By Drug Type (Biologics, Non-Biologics)
- 8.4 Market Segmentation By Therapeutic Area (Infectious Disease, Oncology, Neurological, Metabolic, Others)
- 8.5 Market Segmentation By Patients Type (Pediatric, Adults)
- 8.6 Market Segmentation By Route of Administration (Oral, Injectable)
- 8.7 Market Segmentation By Distribution Channel (Hospitals & Retail Pharmacies, Online Pharmacies)
- 8.8 Europe Rare Disease Drugs Market: Country Analysis
- 8.9 Market Opportunity Chart of Europe Rare Disease Drugs Market - By Country, By Value, 2027
- 8.10 Competitive Scenario of Europe Rare Disease Drugs Market: By Country
- 8.11 Germany Rare Disease Drugs Market: Size and Forecast (2017-2027), By Value
- 8.12 Germany Rare Disease Drugs Market Segmentation - By Drug Type, By Therapeutic Area, By Patients, By Route of Administration, By Distribution Channel (2017-2027)
- 8.13 United Kingdom Rare Disease Drugs Market: Size and Forecast (2017-2027), By Value
- 8.14 United Kingdom Rare Disease Drugs Market Segmentation - By Drug Type, By Therapeutic Area, By Patients, By Route of Administration, By Distribution Channel (2017-2027)
- 8.15 France Rare Disease Drugs Market: Size and Forecast (2017-2027), By Value
- 8.16 France Rare Disease Drugs Market Segmentation - By Drug Type, By Therapeutic Area, By Patients, By Route of Administration, By Distribution Channel (2017-2027)
- 8.17 Italy Rare Disease Drugs Market: Size and Forecast (2017-2027), By Value
- 8.18 Italy Rare Disease Drugs Market Segmentation - By Drug Type, By Therapeutic Area, By Patients, By Route of Administration, By Distribution Channel (2017-2027)
9. Asia Pacific Rare Disease Drugs Market: An Analysis (2017-2027)
- 9.1 Asia Pacific Rare Disease Drugs Market: Size and Forecast (2017-2027), By Value
- 9.2 Asia Pacific Rare Disease Drugs Market - Prominent Companies
- 9.3 Market Segmentation By Drug Type (Biologics, Non-Biologics)
- 9.4 Market Segmentation By Therapeutic Area (Infectious Disease, Oncology, Neurological, Metabolic, Others)
- 9.5 Market Segmentation By Patients Type (Pediatric, Adults)
- 9.6 Market Segmentation By Route of Administration (Oral, Injectable)
- 9.7 Market Segmentation By Distribution Channel (Hospitals & Retail Pharmacies, Online Pharmacies)
- 9.8 Asia Pacific Rare Disease Drugs Market: Country Analysis
- 9.9 Market Opportunity Chart of Asia Pacific Rare Disease Drugs Market - By Country, By Value, 2027
- 9.10 Competitive Scenario of Asia Pacific Rare Disease Drugs Market: By Country
- 9.11 China Rare Disease Drugs Market: Size and Forecast (2017-2027), By Value
- 9.12 China Rare Disease Drugs Market Segmentation - By Drug Type, By Therapeutic Area, By Patients, By Route of Administration, By Distribution Channel (2017-2027)
- 9.13 Japan Rare Disease Drugs Market: Size and Forecast (2017-2027), By Value
- 9.14 Japan Rare Disease Drugs Market Segmentation - By Drug Type, By Therapeutic Area, By Patients, By Route of Administration, By Distribution Channel (2017-2027)
- 9.15 India Rare Disease Drugs Market: Size and Forecast (2017-2027), By Value
- 9.16 India Rare Disease Drugs Market Segmentation - By Drug Type, By Therapeutic Area, By Patients, By Route of Administration, By Distribution Channel (2017-2027)
- 9.17 South Korea Rare Disease Drugs Market: Size and Forecast (2017-2027), By Value
- 9.18 South Korea Rare Disease Drugs Market Segmentation - By Drug Type, By Therapeutic Area, By Patients, By Route of Administration, By Distribution Channel (2017-2027)
10. Global Rare Disease Drugs Market Dynamics
- 10.1 Drivers
- 10.2 Restraints
- 10.3 Trends
11. Market Attractiveness
- 11.1 Market Attractiveness Chart of Global Rare Disease Drugs Market - By Drug Class, 2027
- 11.2 Market Attractiveness Chart of Global Rare Disease Drugs Market - By Therapeutic Area, 2027
- 11.3 Market Attractiveness Chart of Global Rare Disease Drugs Market - By Patients, 2027
- 11.4 Market Attractiveness Chart of Global Rare Disease Drugs Market - By Route of Administration, 2027
- 11.5 Market Attractiveness Chart of Global Rare Disease Drugs Market - By Distribution Channel, 2027
- 11.6 Market Attractiveness Chart of Global Rare Disease Drugs Market - By Region, 2027
12. Competitive Landscape
- 12.1 Market Share Analysis
13. Company Analysis
- 13.1 Takeda Pharmaceutical Company Limited
- 13.2 Sanofi
- 13.3 Merck KGaA
- 13.4 F. Hoffman-La Roche Ltd.
- 13.5 Pfizer
- 13.6 Novartis AG
- 13.7 Bayer Group
- 13.8 Biogen
- 13.9 GlaxoSmithKline
- 13.10 AbbVie Inc.