|
|
市場調査レポート
商品コード
1365715
イベント産業市場:タイプ別、収益源別、主催者別、年齢層別:世界の機会分析と産業予測、2023~2032年Events Industry Market By Type, By Revenue Source, By Organizer, By Age Group : Global Opportunity Analysis and Industry Forecast, 2023-2032 |
||||||
|
|
|||||||


| イベント産業市場:タイプ別、収益源別、主催者別、年齢層別:世界の機会分析と産業予測、2023~2032年 |
|
出版日: 2023年08月01日
発行: Allied Market Research
ページ情報: 英文 249 Pages
納期: 2~3営業日
|
- 全表示
- 概要
- 図表
- 目次
イベント産業市場は2019年に1兆1,000億米ドルと評価され、2032年には2兆1,000億米ドルに達し、2023年から2032年までのCAGRは6.4%で成長すると推定されています。

目次
第1章 イントロダクション
第2章 エグゼクティブサマリー
第3章 市場概要
- 市場の定義と範囲
- 主な調査結果
- 影響要因
- 主な投資機会
- ポーターのファイブフォース分析
- 市場力学
- 促進要因
- イベントへのスポンサーシップの増加
- 起業家・ビジネスセミナーに対する若者の関心の高まり
- 可処分所得の増加
- 抑制要因
- イベント開催にかかる運営コストの高さ
- 既存の巨大参入企業の存在による参入障壁
- 機会
- 技術の進歩
- 促進要因
第4章 イベント産業市場:タイプ別
- 概要
- 音楽コンサート
- フェスティバル
- スポーツ
- 展示会・会議
- 企業イベント・セミナー
- その他
第5章 イベント産業市場:収入源別
- 概要
- チケット販売
- スポンサーシップ
- その他
第6章 イベント産業市場:主催者別
- 概要
- 企業
- スポーツ
- 教育
- エンターテインメント
- その他
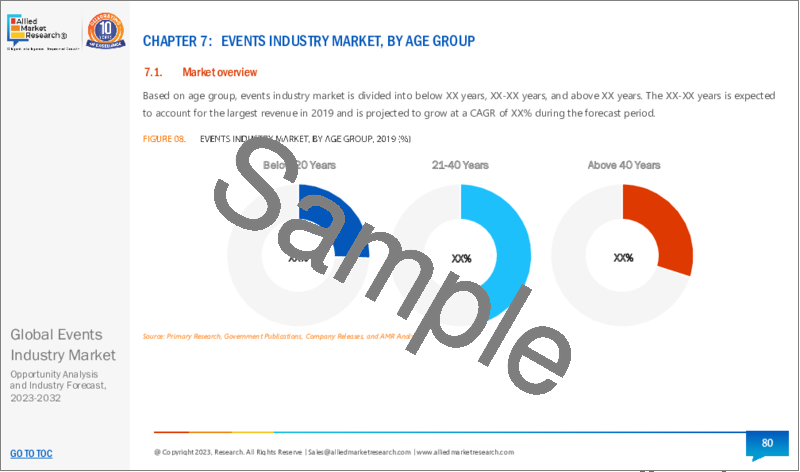
第7章 イベント産業市場:年齢層別
- 概要
- 20歳未満
- 21~40歳
- 40歳以上
第8章 イベント産業市場:地域別
- 概要
- 北米
- 米国
- カナダ
- メキシコ
- 欧州
- ドイツ
- フランス
- 英国
- イタリア
- スペイン
- ロシア
- オランダ
- スウェーデン
- ベルギー
- デンマーク
- フィンランド
- ポーランド
- チェコ
- ハンガリー
- ルーマニア
- その他
- アジア太平洋
- 日本
- 中国
- オーストラリア
- インド
- シンガポール
- インドネシア
- フィリピン
- タイ
- マレーシア
- その他
- ラテンアメリカ・中東・アフリカ
- ブラジル
- アルゼンチン
- サウジアラビア
- 南アフリカ
- アラブ首長国連邦
- カタール
- エジプト
- ナイジェリア
- その他
第9章 競合情勢
- イントロダクション
- 主要成功戦略
- 主要10社の製品マッピング
- 競合ダッシュボード
- 競合ヒートマップ
- 主要企業のポジショニング、2019年
第10章 企業プロファイル
- Anschutz Entertainment Group
- Access Destination Services, LLC
- BCD Group International BV
- Capita plc.
- CL Events
- Clarion Events Limited
- Cvent Holding Corp.
- DRPG Group
- Entertaining Asia
- ATPI Ltd.
LIST OF TABLES
- TABLE 01. GLOBAL EVENTS INDUSTRY MARKET, BY TYPE, 2019-2032 ($BILLION)
- TABLE 02. EVENTS INDUSTRY MARKET FOR MUSIC CONCERT, BY REGION, 2019-2032 ($BILLION)
- TABLE 03. EVENTS INDUSTRY MARKET FOR FESTIVALS, BY REGION, 2019-2032 ($BILLION)
- TABLE 04. EVENTS INDUSTRY MARKET FOR SPORTS, BY REGION, 2019-2032 ($BILLION)
- TABLE 05. EVENTS INDUSTRY MARKET FOR EXHIBITIONS AND CONFERENCES, BY REGION, 2019-2032 ($BILLION)
- TABLE 06. EVENTS INDUSTRY MARKET FOR CORPORATE EVENTS AND SEMINARS, BY REGION, 2019-2032 ($BILLION)
- TABLE 07. EVENTS INDUSTRY MARKET FOR OTHERS, BY REGION, 2019-2032 ($BILLION)
- TABLE 08. GLOBAL EVENTS INDUSTRY MARKET, BY REVENUE SOURCE, 2019-2032 ($BILLION)
- TABLE 09. EVENTS INDUSTRY MARKET FOR TICKET SALE, BY REGION, 2019-2032 ($BILLION)
- TABLE 10. EVENTS INDUSTRY MARKET FOR SPONSORSHIP, BY REGION, 2019-2032 ($BILLION)
- TABLE 11. EVENTS INDUSTRY MARKET FOR OTHERS, BY REGION, 2019-2032 ($BILLION)
- TABLE 12. GLOBAL EVENTS INDUSTRY MARKET, BY ORGANIZER, 2019-2032 ($BILLION)
- TABLE 13. EVENTS INDUSTRY MARKET FOR CORPORATE, BY REGION, 2019-2032 ($BILLION)
- TABLE 14. EVENTS INDUSTRY MARKET FOR SPORTS, BY REGION, 2019-2032 ($BILLION)
- TABLE 15. EVENTS INDUSTRY MARKET FOR EDUCATION, BY REGION, 2019-2032 ($BILLION)
- TABLE 16. EVENTS INDUSTRY MARKET FOR ENTERTAINMENT, BY REGION, 2019-2032 ($BILLION)
- TABLE 17. EVENTS INDUSTRY MARKET FOR OTHERS, BY REGION, 2019-2032 ($BILLION)
- TABLE 18. GLOBAL EVENTS INDUSTRY MARKET, BY AGE GROUP, 2019-2032 ($BILLION)
- TABLE 19. EVENTS INDUSTRY MARKET FOR BELOW 20 YEARS, BY REGION, 2019-2032 ($BILLION)
- TABLE 20. EVENTS INDUSTRY MARKET FOR 21-40 YEARS, BY REGION, 2019-2032 ($BILLION)
- TABLE 21. EVENTS INDUSTRY MARKET FOR ABOVE 40 YEARS, BY REGION, 2019-2032 ($BILLION)
- TABLE 22. EVENTS INDUSTRY MARKET, BY REGION, 2019-2032 ($BILLION)
- TABLE 23. NORTH AMERICA EVENTS INDUSTRY MARKET, BY TYPE, 2019-2032 ($BILLION)
- TABLE 24. NORTH AMERICA EVENTS INDUSTRY MARKET, BY REVENUE SOURCE, 2019-2032 ($BILLION)
- TABLE 25. NORTH AMERICA EVENTS INDUSTRY MARKET, BY ORGANIZER, 2019-2032 ($BILLION)
- TABLE 26. NORTH AMERICA EVENTS INDUSTRY MARKET, BY AGE GROUP, 2019-2032 ($BILLION)
- TABLE 27. NORTH AMERICA EVENTS INDUSTRY MARKET, BY COUNTRY, 2019-2032 ($BILLION)
- TABLE 28. U.S. EVENTS INDUSTRY MARKET, BY TYPE, 2019-2032 ($BILLION)
- TABLE 29. U.S. EVENTS INDUSTRY MARKET, BY REVENUE SOURCE, 2019-2032 ($BILLION)
- TABLE 30. U.S. EVENTS INDUSTRY MARKET, BY ORGANIZER, 2019-2032 ($BILLION)
- TABLE 31. U.S. EVENTS INDUSTRY MARKET, BY AGE GROUP, 2019-2032 ($BILLION)
- TABLE 32. CANADA EVENTS INDUSTRY MARKET, BY TYPE, 2019-2032 ($BILLION)
- TABLE 33. CANADA EVENTS INDUSTRY MARKET, BY REVENUE SOURCE, 2019-2032 ($BILLION)
- TABLE 34. CANADA EVENTS INDUSTRY MARKET, BY ORGANIZER, 2019-2032 ($BILLION)
- TABLE 35. CANADA EVENTS INDUSTRY MARKET, BY AGE GROUP, 2019-2032 ($BILLION)
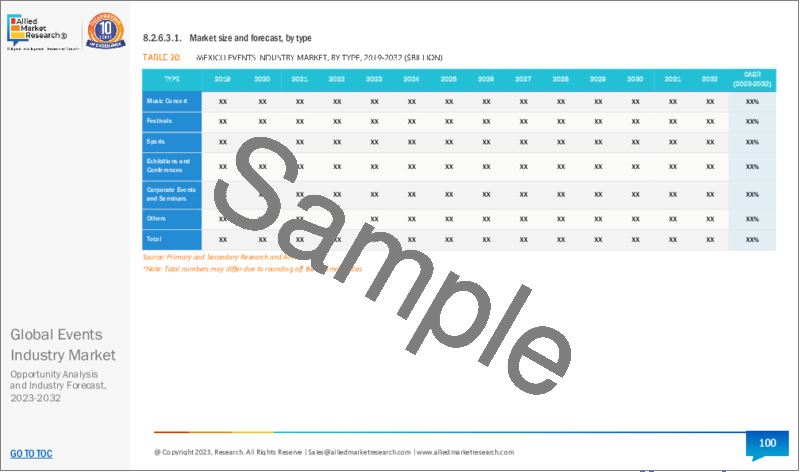
- TABLE 36. MEXICO EVENTS INDUSTRY MARKET, BY TYPE, 2019-2032 ($BILLION)
- TABLE 37. MEXICO EVENTS INDUSTRY MARKET, BY REVENUE SOURCE, 2019-2032 ($BILLION)
- TABLE 38. MEXICO EVENTS INDUSTRY MARKET, BY ORGANIZER, 2019-2032 ($BILLION)
- TABLE 39. MEXICO EVENTS INDUSTRY MARKET, BY AGE GROUP, 2019-2032 ($BILLION)
- TABLE 40. EUROPE EVENTS INDUSTRY MARKET, BY TYPE, 2019-2032 ($BILLION)
- TABLE 41. EUROPE EVENTS INDUSTRY MARKET, BY REVENUE SOURCE, 2019-2032 ($BILLION)
- TABLE 42. EUROPE EVENTS INDUSTRY MARKET, BY ORGANIZER, 2019-2032 ($BILLION)
- TABLE 43. EUROPE EVENTS INDUSTRY MARKET, BY AGE GROUP, 2019-2032 ($BILLION)
- TABLE 44. EUROPE EVENTS INDUSTRY MARKET, BY COUNTRY, 2019-2032 ($BILLION)
- TABLE 45. GERMANY EVENTS INDUSTRY MARKET, BY TYPE, 2019-2032 ($BILLION)
- TABLE 46. GERMANY EVENTS INDUSTRY MARKET, BY REVENUE SOURCE, 2019-2032 ($BILLION)
- TABLE 47. GERMANY EVENTS INDUSTRY MARKET, BY ORGANIZER, 2019-2032 ($BILLION)
- TABLE 48. GERMANY EVENTS INDUSTRY MARKET, BY AGE GROUP, 2019-2032 ($BILLION)
- TABLE 49. FRANCE EVENTS INDUSTRY MARKET, BY TYPE, 2019-2032 ($BILLION)
- TABLE 50. FRANCE EVENTS INDUSTRY MARKET, BY REVENUE SOURCE, 2019-2032 ($BILLION)
- TABLE 51. FRANCE EVENTS INDUSTRY MARKET, BY ORGANIZER, 2019-2032 ($BILLION)
- TABLE 52. FRANCE EVENTS INDUSTRY MARKET, BY AGE GROUP, 2019-2032 ($BILLION)
- TABLE 53. UK EVENTS INDUSTRY MARKET, BY TYPE, 2019-2032 ($BILLION)
- TABLE 54. UK EVENTS INDUSTRY MARKET, BY REVENUE SOURCE, 2019-2032 ($BILLION)
- TABLE 55. UK EVENTS INDUSTRY MARKET, BY ORGANIZER, 2019-2032 ($BILLION)
- TABLE 56. UK EVENTS INDUSTRY MARKET, BY AGE GROUP, 2019-2032 ($BILLION)
- TABLE 57. ITALY EVENTS INDUSTRY MARKET, BY TYPE, 2019-2032 ($BILLION)
- TABLE 58. ITALY EVENTS INDUSTRY MARKET, BY REVENUE SOURCE, 2019-2032 ($BILLION)
- TABLE 59. ITALY EVENTS INDUSTRY MARKET, BY ORGANIZER, 2019-2032 ($BILLION)
- TABLE 60. ITALY EVENTS INDUSTRY MARKET, BY AGE GROUP, 2019-2032 ($BILLION)
- TABLE 61. SPAIN EVENTS INDUSTRY MARKET, BY TYPE, 2019-2032 ($BILLION)
- TABLE 62. SPAIN EVENTS INDUSTRY MARKET, BY REVENUE SOURCE, 2019-2032 ($BILLION)
- TABLE 63. SPAIN EVENTS INDUSTRY MARKET, BY ORGANIZER, 2019-2032 ($BILLION)
- TABLE 64. SPAIN EVENTS INDUSTRY MARKET, BY AGE GROUP, 2019-2032 ($BILLION)
- TABLE 65. RUSSIA EVENTS INDUSTRY MARKET, BY TYPE, 2019-2032 ($BILLION)
- TABLE 66. RUSSIA EVENTS INDUSTRY MARKET, BY REVENUE SOURCE, 2019-2032 ($BILLION)
- TABLE 67. RUSSIA EVENTS INDUSTRY MARKET, BY ORGANIZER, 2019-2032 ($BILLION)
- TABLE 68. RUSSIA EVENTS INDUSTRY MARKET, BY AGE GROUP, 2019-2032 ($BILLION)
- TABLE 69. NETHERLANDS EVENTS INDUSTRY MARKET, BY TYPE, 2019-2032 ($BILLION)
- TABLE 70. NETHERLANDS EVENTS INDUSTRY MARKET, BY REVENUE SOURCE, 2019-2032 ($BILLION)
- TABLE 71. NETHERLANDS EVENTS INDUSTRY MARKET, BY ORGANIZER, 2019-2032 ($BILLION)
- TABLE 72. NETHERLANDS EVENTS INDUSTRY MARKET, BY AGE GROUP, 2019-2032 ($BILLION)
- TABLE 73. SWEDEN EVENTS INDUSTRY MARKET, BY TYPE, 2019-2032 ($BILLION)
- TABLE 74. SWEDEN EVENTS INDUSTRY MARKET, BY REVENUE SOURCE, 2019-2032 ($BILLION)
- TABLE 75. SWEDEN EVENTS INDUSTRY MARKET, BY ORGANIZER, 2019-2032 ($BILLION)
- TABLE 76. SWEDEN EVENTS INDUSTRY MARKET, BY AGE GROUP, 2019-2032 ($BILLION)
- TABLE 77. BELGIUM EVENTS INDUSTRY MARKET, BY TYPE, 2019-2032 ($BILLION)
- TABLE 78. BELGIUM EVENTS INDUSTRY MARKET, BY REVENUE SOURCE, 2019-2032 ($BILLION)
- TABLE 79. BELGIUM EVENTS INDUSTRY MARKET, BY ORGANIZER, 2019-2032 ($BILLION)
- TABLE 80. BELGIUM EVENTS INDUSTRY MARKET, BY AGE GROUP, 2019-2032 ($BILLION)
- TABLE 81. DENMARK EVENTS INDUSTRY MARKET, BY TYPE, 2019-2032 ($BILLION)
- TABLE 82. DENMARK EVENTS INDUSTRY MARKET, BY REVENUE SOURCE, 2019-2032 ($BILLION)
- TABLE 83. DENMARK EVENTS INDUSTRY MARKET, BY ORGANIZER, 2019-2032 ($BILLION)
- TABLE 84. DENMARK EVENTS INDUSTRY MARKET, BY AGE GROUP, 2019-2032 ($BILLION)
- TABLE 85. FINLAND EVENTS INDUSTRY MARKET, BY TYPE, 2019-2032 ($BILLION)
- TABLE 86. FINLAND EVENTS INDUSTRY MARKET, BY REVENUE SOURCE, 2019-2032 ($BILLION)
- TABLE 87. FINLAND EVENTS INDUSTRY MARKET, BY ORGANIZER, 2019-2032 ($BILLION)
- TABLE 88. FINLAND EVENTS INDUSTRY MARKET, BY AGE GROUP, 2019-2032 ($BILLION)
- TABLE 89. POLAND EVENTS INDUSTRY MARKET, BY TYPE, 2019-2032 ($BILLION)
- TABLE 90. POLAND EVENTS INDUSTRY MARKET, BY REVENUE SOURCE, 2019-2032 ($BILLION)
- TABLE 91. POLAND EVENTS INDUSTRY MARKET, BY ORGANIZER, 2019-2032 ($BILLION)
- TABLE 92. POLAND EVENTS INDUSTRY MARKET, BY AGE GROUP, 2019-2032 ($BILLION)
- TABLE 93. CZEHIA EVENTS INDUSTRY MARKET, BY TYPE, 2019-2032 ($BILLION)
- TABLE 94. CZEHIA EVENTS INDUSTRY MARKET, BY REVENUE SOURCE, 2019-2032 ($BILLION)
- TABLE 95. CZEHIA EVENTS INDUSTRY MARKET, BY ORGANIZER, 2019-2032 ($BILLION)
- TABLE 96. CZEHIA EVENTS INDUSTRY MARKET, BY AGE GROUP, 2019-2032 ($BILLION)
- TABLE 97. HUNGARY EVENTS INDUSTRY MARKET, BY TYPE, 2019-2032 ($BILLION)
- TABLE 98. HUNGARY EVENTS INDUSTRY MARKET, BY REVENUE SOURCE, 2019-2032 ($BILLION)
- TABLE 99. HUNGARY EVENTS INDUSTRY MARKET, BY ORGANIZER, 2019-2032 ($BILLION)
- TABLE 100. HUNGARY EVENTS INDUSTRY MARKET, BY AGE GROUP, 2019-2032 ($BILLION)
- TABLE 101. ROMANIA EVENTS INDUSTRY MARKET, BY TYPE, 2019-2032 ($BILLION)
- TABLE 102. ROMANIA EVENTS INDUSTRY MARKET, BY REVENUE SOURCE, 2019-2032 ($BILLION)
- TABLE 103. ROMANIA EVENTS INDUSTRY MARKET, BY ORGANIZER, 2019-2032 ($BILLION)
- TABLE 104. ROMANIA EVENTS INDUSTRY MARKET, BY AGE GROUP, 2019-2032 ($BILLION)
- TABLE 105. REST OF EUROPE EVENTS INDUSTRY MARKET, BY TYPE, 2019-2032 ($BILLION)
- TABLE 106. REST OF EUROPE EVENTS INDUSTRY MARKET, BY REVENUE SOURCE, 2019-2032 ($BILLION)
- TABLE 107. REST OF EUROPE EVENTS INDUSTRY MARKET, BY ORGANIZER, 2019-2032 ($BILLION)
- TABLE 108. REST OF EUROPE EVENTS INDUSTRY MARKET, BY AGE GROUP, 2019-2032 ($BILLION)
- TABLE 109. ASIA-PACIFIC EVENTS INDUSTRY MARKET, BY TYPE, 2019-2032 ($BILLION)
- TABLE 110. ASIA-PACIFIC EVENTS INDUSTRY MARKET, BY REVENUE SOURCE, 2019-2032 ($BILLION)
- TABLE 111. ASIA-PACIFIC EVENTS INDUSTRY MARKET, BY ORGANIZER, 2019-2032 ($BILLION)
- TABLE 112. ASIA-PACIFIC EVENTS INDUSTRY MARKET, BY AGE GROUP, 2019-2032 ($BILLION)
- TABLE 113. ASIA-PACIFIC EVENTS INDUSTRY MARKET, BY COUNTRY, 2019-2032 ($BILLION)
- TABLE 114. JAPAN EVENTS INDUSTRY MARKET, BY TYPE, 2019-2032 ($BILLION)
- TABLE 115. JAPAN EVENTS INDUSTRY MARKET, BY REVENUE SOURCE, 2019-2032 ($BILLION)
- TABLE 116. JAPAN EVENTS INDUSTRY MARKET, BY ORGANIZER, 2019-2032 ($BILLION)
- TABLE 117. JAPAN EVENTS INDUSTRY MARKET, BY AGE GROUP, 2019-2032 ($BILLION)
- TABLE 118. CHINA EVENTS INDUSTRY MARKET, BY TYPE, 2019-2032 ($BILLION)
- TABLE 119. CHINA EVENTS INDUSTRY MARKET, BY REVENUE SOURCE, 2019-2032 ($BILLION)
- TABLE 120. CHINA EVENTS INDUSTRY MARKET, BY ORGANIZER, 2019-2032 ($BILLION)
- TABLE 121. CHINA EVENTS INDUSTRY MARKET, BY AGE GROUP, 2019-2032 ($BILLION)
- TABLE 122. AUSTRALIA EVENTS INDUSTRY MARKET, BY TYPE, 2019-2032 ($BILLION)
- TABLE 123. AUSTRALIA EVENTS INDUSTRY MARKET, BY REVENUE SOURCE, 2019-2032 ($BILLION)
- TABLE 124. AUSTRALIA EVENTS INDUSTRY MARKET, BY ORGANIZER, 2019-2032 ($BILLION)
- TABLE 125. AUSTRALIA EVENTS INDUSTRY MARKET, BY AGE GROUP, 2019-2032 ($BILLION)
- TABLE 126. INDIA EVENTS INDUSTRY MARKET, BY TYPE, 2019-2032 ($BILLION)
- TABLE 127. INDIA EVENTS INDUSTRY MARKET, BY REVENUE SOURCE, 2019-2032 ($BILLION)
- TABLE 128. INDIA EVENTS INDUSTRY MARKET, BY ORGANIZER, 2019-2032 ($BILLION)
- TABLE 129. INDIA EVENTS INDUSTRY MARKET, BY AGE GROUP, 2019-2032 ($BILLION)
- TABLE 130. SINGAPORE EVENTS INDUSTRY MARKET, BY TYPE, 2019-2032 ($BILLION)
- TABLE 131. SINGAPORE EVENTS INDUSTRY MARKET, BY REVENUE SOURCE, 2019-2032 ($BILLION)
- TABLE 132. SINGAPORE EVENTS INDUSTRY MARKET, BY ORGANIZER, 2019-2032 ($BILLION)
- TABLE 133. SINGAPORE EVENTS INDUSTRY MARKET, BY AGE GROUP, 2019-2032 ($BILLION)
- TABLE 134. INDONESIA EVENTS INDUSTRY MARKET, BY TYPE, 2019-2032 ($BILLION)
- TABLE 135. INDONESIA EVENTS INDUSTRY MARKET, BY REVENUE SOURCE, 2019-2032 ($BILLION)
- TABLE 136. INDONESIA EVENTS INDUSTRY MARKET, BY ORGANIZER, 2019-2032 ($BILLION)
- TABLE 137. INDONESIA EVENTS INDUSTRY MARKET, BY AGE GROUP, 2019-2032 ($BILLION)
- TABLE 138. PHILIPPINES EVENTS INDUSTRY MARKET, BY TYPE, 2019-2032 ($BILLION)
- TABLE 139. PHILIPPINES EVENTS INDUSTRY MARKET, BY REVENUE SOURCE, 2019-2032 ($BILLION)
- TABLE 140. PHILIPPINES EVENTS INDUSTRY MARKET, BY ORGANIZER, 2019-2032 ($BILLION)
- TABLE 141. PHILIPPINES EVENTS INDUSTRY MARKET, BY AGE GROUP, 2019-2032 ($BILLION)
- TABLE 142. THAILAND EVENTS INDUSTRY MARKET, BY TYPE, 2019-2032 ($BILLION)
- TABLE 143. THAILAND EVENTS INDUSTRY MARKET, BY REVENUE SOURCE, 2019-2032 ($BILLION)
- TABLE 144. THAILAND EVENTS INDUSTRY MARKET, BY ORGANIZER, 2019-2032 ($BILLION)
- TABLE 145. THAILAND EVENTS INDUSTRY MARKET, BY AGE GROUP, 2019-2032 ($BILLION)
- TABLE 146. MALAYSIA EVENTS INDUSTRY MARKET, BY TYPE, 2019-2032 ($BILLION)
- TABLE 147. MALAYSIA EVENTS INDUSTRY MARKET, BY REVENUE SOURCE, 2019-2032 ($BILLION)
- TABLE 148. MALAYSIA EVENTS INDUSTRY MARKET, BY ORGANIZER, 2019-2032 ($BILLION)
- TABLE 149. MALAYSIA EVENTS INDUSTRY MARKET, BY AGE GROUP, 2019-2032 ($BILLION)
- TABLE 150. REST OF ASIA-PACIFIC EVENTS INDUSTRY MARKET, BY TYPE, 2019-2032 ($BILLION)
- TABLE 151. REST OF ASIA-PACIFIC EVENTS INDUSTRY MARKET, BY REVENUE SOURCE, 2019-2032 ($BILLION)
- TABLE 152. REST OF ASIA-PACIFIC EVENTS INDUSTRY MARKET, BY ORGANIZER, 2019-2032 ($BILLION)
- TABLE 153. REST OF ASIA-PACIFIC EVENTS INDUSTRY MARKET, BY AGE GROUP, 2019-2032 ($BILLION)
- TABLE 154. LAMEA EVENTS INDUSTRY MARKET, BY TYPE, 2019-2032 ($BILLION)
- TABLE 155. LAMEA EVENTS INDUSTRY MARKET, BY REVENUE SOURCE, 2019-2032 ($BILLION)
- TABLE 156. LAMEA EVENTS INDUSTRY MARKET, BY ORGANIZER, 2019-2032 ($BILLION)
- TABLE 157. LAMEA EVENTS INDUSTRY MARKET, BY AGE GROUP, 2019-2032 ($BILLION)
- TABLE 158. LAMEA EVENTS INDUSTRY MARKET, BY COUNTRY, 2019-2032 ($BILLION)
- TABLE 159. BRAZIL EVENTS INDUSTRY MARKET, BY TYPE, 2019-2032 ($BILLION)
- TABLE 160. BRAZIL EVENTS INDUSTRY MARKET, BY REVENUE SOURCE, 2019-2032 ($BILLION)
- TABLE 161. BRAZIL EVENTS INDUSTRY MARKET, BY ORGANIZER, 2019-2032 ($BILLION)
- TABLE 162. BRAZIL EVENTS INDUSTRY MARKET, BY AGE GROUP, 2019-2032 ($BILLION)
- TABLE 163. ARGENTINA EVENTS INDUSTRY MARKET, BY TYPE, 2019-2032 ($BILLION)
- TABLE 164. ARGENTINA EVENTS INDUSTRY MARKET, BY REVENUE SOURCE, 2019-2032 ($BILLION)
- TABLE 165. ARGENTINA EVENTS INDUSTRY MARKET, BY ORGANIZER, 2019-2032 ($BILLION)
- TABLE 166. ARGENTINA EVENTS INDUSTRY MARKET, BY AGE GROUP, 2019-2032 ($BILLION)
- TABLE 167. SAUDI ARABIA EVENTS INDUSTRY MARKET, BY TYPE, 2019-2032 ($BILLION)
- TABLE 168. SAUDI ARABIA EVENTS INDUSTRY MARKET, BY REVENUE SOURCE, 2019-2032 ($BILLION)
- TABLE 169. SAUDI ARABIA EVENTS INDUSTRY MARKET, BY ORGANIZER, 2019-2032 ($BILLION)
- TABLE 170. SAUDI ARABIA EVENTS INDUSTRY MARKET, BY AGE GROUP, 2019-2032 ($BILLION)
- TABLE 171. SOUTH AFRICA EVENTS INDUSTRY MARKET, BY TYPE, 2019-2032 ($BILLION)
- TABLE 172. SOUTH AFRICA EVENTS INDUSTRY MARKET, BY REVENUE SOURCE, 2019-2032 ($BILLION)
- TABLE 173. SOUTH AFRICA EVENTS INDUSTRY MARKET, BY ORGANIZER, 2019-2032 ($BILLION)
- TABLE 174. SOUTH AFRICA EVENTS INDUSTRY MARKET, BY AGE GROUP, 2019-2032 ($BILLION)
- TABLE 175. UAE EVENTS INDUSTRY MARKET, BY TYPE, 2019-2032 ($BILLION)
- TABLE 176. UAE EVENTS INDUSTRY MARKET, BY REVENUE SOURCE, 2019-2032 ($BILLION)
- TABLE 177. UAE EVENTS INDUSTRY MARKET, BY ORGANIZER, 2019-2032 ($BILLION)
- TABLE 178. UAE EVENTS INDUSTRY MARKET, BY AGE GROUP, 2019-2032 ($BILLION)
- TABLE 179. QATAR EVENTS INDUSTRY MARKET, BY TYPE, 2019-2032 ($BILLION)
- TABLE 180. QATAR EVENTS INDUSTRY MARKET, BY REVENUE SOURCE, 2019-2032 ($BILLION)
- TABLE 181. QATAR EVENTS INDUSTRY MARKET, BY ORGANIZER, 2019-2032 ($BILLION)
- TABLE 182. QATAR EVENTS INDUSTRY MARKET, BY AGE GROUP, 2019-2032 ($BILLION)
- TABLE 183. EGYPT EVENTS INDUSTRY MARKET, BY TYPE, 2019-2032 ($BILLION)
- TABLE 184. EGYPT EVENTS INDUSTRY MARKET, BY REVENUE SOURCE, 2019-2032 ($BILLION)
- TABLE 185. EGYPT EVENTS INDUSTRY MARKET, BY ORGANIZER, 2019-2032 ($BILLION)
- TABLE 186. EGYPT EVENTS INDUSTRY MARKET, BY AGE GROUP, 2019-2032 ($BILLION)
- TABLE 187. NIGERIA EVENTS INDUSTRY MARKET, BY TYPE, 2019-2032 ($BILLION)
- TABLE 188. NIGERIA EVENTS INDUSTRY MARKET, BY REVENUE SOURCE, 2019-2032 ($BILLION)
- TABLE 189. NIGERIA EVENTS INDUSTRY MARKET, BY ORGANIZER, 2019-2032 ($BILLION)
- TABLE 190. NIGERIA EVENTS INDUSTRY MARKET, BY AGE GROUP, 2019-2032 ($BILLION)
- TABLE 191. REST OF LAMEA EVENTS INDUSTRY MARKET, BY TYPE, 2019-2032 ($BILLION)
- TABLE 192. REST OF LAMEA EVENTS INDUSTRY MARKET, BY REVENUE SOURCE, 2019-2032 ($BILLION)
- TABLE 193. REST OF LAMEA EVENTS INDUSTRY MARKET, BY ORGANIZER, 2019-2032 ($BILLION)
- TABLE 194. REST OF LAMEA EVENTS INDUSTRY MARKET, BY AGE GROUP, 2019-2032 ($BILLION)
- TABLE 195. ANSCHUTZ ENTERTAINMENT GROUP: KEY EXECUTIVES
- TABLE 196. ANSCHUTZ ENTERTAINMENT GROUP: COMPANY SNAPSHOT
- TABLE 197. ANSCHUTZ ENTERTAINMENT GROUP: SERVICE SEGMENTS
- TABLE 198. ANSCHUTZ ENTERTAINMENT GROUP: PRODUCT PORTFOLIO
- TABLE 199. ANSCHUTZ ENTERTAINMENT GROUP: KEY STRATERGIES
- TABLE 200. ACCESS DESTINATION SERVICES, LLC: KEY EXECUTIVES
- TABLE 201. ACCESS DESTINATION SERVICES, LLC: COMPANY SNAPSHOT
- TABLE 202. ACCESS DESTINATION SERVICES, LLC: SERVICE SEGMENTS
- TABLE 203. ACCESS DESTINATION SERVICES, LLC: PRODUCT PORTFOLIO
- TABLE 204. ACCESS DESTINATION SERVICES, LLC: KEY STRATERGIES
- TABLE 205. BCD GROUP INTERNATIONAL BV: KEY EXECUTIVES
- TABLE 206. BCD GROUP INTERNATIONAL BV: COMPANY SNAPSHOT
- TABLE 207. BCD GROUP INTERNATIONAL BV: SERVICE SEGMENTS
- TABLE 208. BCD GROUP INTERNATIONAL BV: PRODUCT PORTFOLIO
- TABLE 209. BCD GROUP INTERNATIONAL BV: KEY STRATERGIES
- TABLE 210. CAPITA PLC.: KEY EXECUTIVES
- TABLE 211. CAPITA PLC.: COMPANY SNAPSHOT
- TABLE 212. CAPITA PLC.: SERVICE SEGMENTS
- TABLE 213. CAPITA PLC.: PRODUCT PORTFOLIO
- TABLE 214. CL EVENTS: KEY EXECUTIVES
- TABLE 215. CL EVENTS: COMPANY SNAPSHOT
- TABLE 216. CL EVENTS: SERVICE SEGMENTS
- TABLE 217. CL EVENTS: PRODUCT PORTFOLIO
- TABLE 218. CLARION EVENTS LIMITED: KEY EXECUTIVES
- TABLE 219. CLARION EVENTS LIMITED: COMPANY SNAPSHOT
- TABLE 220. CLARION EVENTS LIMITED: SERVICE SEGMENTS
- TABLE 221. CLARION EVENTS LIMITED: PRODUCT PORTFOLIO
- TABLE 222. CLARION EVENTS LIMITED: KEY STRATERGIES
- TABLE 223. CVENT HOLDING CORP.: KEY EXECUTIVES
- TABLE 224. CVENT HOLDING CORP.: COMPANY SNAPSHOT
- TABLE 225. CVENT HOLDING CORP.: SERVICE SEGMENTS
- TABLE 226. CVENT HOLDING CORP.: PRODUCT PORTFOLIO
- TABLE 227. CVENT HOLDING CORP.: KEY STRATERGIES
- TABLE 228. DRPG GROUP: KEY EXECUTIVES
- TABLE 229. DRPG GROUP: COMPANY SNAPSHOT
- TABLE 230. DRPG GROUP: SERVICE SEGMENTS
- TABLE 231. DRPG GROUP: PRODUCT PORTFOLIO
- TABLE 232. ENTERTAINING ASIA: KEY EXECUTIVES
- TABLE 233. ENTERTAINING ASIA: COMPANY SNAPSHOT
- TABLE 234. ENTERTAINING ASIA: SERVICE SEGMENTS
- TABLE 235. ENTERTAINING ASIA: PRODUCT PORTFOLIO
- TABLE 236. ATPI LTD.: KEY EXECUTIVES
- TABLE 237. ATPI LTD.: COMPANY SNAPSHOT
- TABLE 238. ATPI LTD.: SERVICE SEGMENTS
- TABLE 239. ATPI LTD.: PRODUCT PORTFOLIO
- TABLE 240. ATPI LTD.: KEY STRATERGIES
LIST OF FIGURES
- FIGURE 01. EVENTS INDUSTRY MARKET, 2019-2032
- FIGURE 02. SEGMENTATION OF EVENTS INDUSTRY MARKET,2019-2032
- FIGURE 03. TOP INVESTMENT POCKETS IN EVENTS INDUSTRY MARKET (2023-2032)
- FIGURE 04. MODERATE BARGAINING POWER OF SUPPLIERS
- FIGURE 05. MODERATE THREAT OF NEW ENTRANTS
- FIGURE 06. MODERATE THREAT OF SUBSTITUTES
- FIGURE 07. MODERATE INTENSITY OF RIVALRY
- FIGURE 08. MODERATE BARGAINING POWER OF BUYERS
- FIGURE 09. GLOBAL EVENTS INDUSTRY MARKET:DRIVERS, RESTRAINTS AND OPPORTUNITIES
- FIGURE 10. EVENTS INDUSTRY MARKET, BY TYPE, 2019 AND 2032(%)
- FIGURE 11. COMPARATIVE SHARE ANALYSIS OF EVENTS INDUSTRY MARKET FOR MUSIC CONCERT, BY COUNTRY 2019 AND 2032(%)
- FIGURE 12. COMPARATIVE SHARE ANALYSIS OF EVENTS INDUSTRY MARKET FOR FESTIVALS, BY COUNTRY 2019 AND 2032(%)
- FIGURE 13. COMPARATIVE SHARE ANALYSIS OF EVENTS INDUSTRY MARKET FOR SPORTS, BY COUNTRY 2019 AND 2032(%)
- FIGURE 14. COMPARATIVE SHARE ANALYSIS OF EVENTS INDUSTRY MARKET FOR EXHIBITIONS AND CONFERENCES, BY COUNTRY 2019 AND 2032(%)
- FIGURE 15. COMPARATIVE SHARE ANALYSIS OF EVENTS INDUSTRY MARKET FOR CORPORATE EVENTS AND SEMINARS, BY COUNTRY 2019 AND 2032(%)
- FIGURE 16. COMPARATIVE SHARE ANALYSIS OF EVENTS INDUSTRY MARKET FOR OTHERS, BY COUNTRY 2019 AND 2032(%)
- FIGURE 17. EVENTS INDUSTRY MARKET, BY REVENUE SOURCE, 2019 AND 2032(%)
- FIGURE 18. COMPARATIVE SHARE ANALYSIS OF EVENTS INDUSTRY MARKET FOR TICKET SALE, BY COUNTRY 2019 AND 2032(%)
- FIGURE 19. COMPARATIVE SHARE ANALYSIS OF EVENTS INDUSTRY MARKET FOR SPONSORSHIP, BY COUNTRY 2019 AND 2032(%)
- FIGURE 20. COMPARATIVE SHARE ANALYSIS OF EVENTS INDUSTRY MARKET FOR OTHERS, BY COUNTRY 2019 AND 2032(%)
- FIGURE 21. EVENTS INDUSTRY MARKET, BY ORGANIZER, 2019 AND 2032(%)
- FIGURE 22. COMPARATIVE SHARE ANALYSIS OF EVENTS INDUSTRY MARKET FOR CORPORATE, BY COUNTRY 2019 AND 2032(%)
- FIGURE 23. COMPARATIVE SHARE ANALYSIS OF EVENTS INDUSTRY MARKET FOR SPORTS, BY COUNTRY 2019 AND 2032(%)
- FIGURE 24. COMPARATIVE SHARE ANALYSIS OF EVENTS INDUSTRY MARKET FOR EDUCATION, BY COUNTRY 2019 AND 2032(%)
- FIGURE 25. COMPARATIVE SHARE ANALYSIS OF EVENTS INDUSTRY MARKET FOR ENTERTAINMENT, BY COUNTRY 2019 AND 2032(%)
- FIGURE 26. COMPARATIVE SHARE ANALYSIS OF EVENTS INDUSTRY MARKET FOR OTHERS, BY COUNTRY 2019 AND 2032(%)
- FIGURE 27. EVENTS INDUSTRY MARKET, BY AGE GROUP, 2019 AND 2032(%)
- FIGURE 28. COMPARATIVE SHARE ANALYSIS OF EVENTS INDUSTRY MARKET FOR BELOW 20 YEARS, BY COUNTRY 2019 AND 2032(%)
- FIGURE 29. COMPARATIVE SHARE ANALYSIS OF EVENTS INDUSTRY MARKET FOR 21-40 YEARS, BY COUNTRY 2019 AND 2032(%)
- FIGURE 30. COMPARATIVE SHARE ANALYSIS OF EVENTS INDUSTRY MARKET FOR ABOVE 40 YEARS, BY COUNTRY 2019 AND 2032(%)
- FIGURE 31. EVENTS INDUSTRY MARKET BY REGION, 2019 AND 2032(%)
- FIGURE 32. U.S. EVENTS INDUSTRY MARKET, 2019-2032 ($BILLION)
- FIGURE 33. CANADA EVENTS INDUSTRY MARKET, 2019-2032 ($BILLION)
- FIGURE 34. MEXICO EVENTS INDUSTRY MARKET, 2019-2032 ($BILLION)
- FIGURE 35. GERMANY EVENTS INDUSTRY MARKET, 2019-2032 ($BILLION)
- FIGURE 36. FRANCE EVENTS INDUSTRY MARKET, 2019-2032 ($BILLION)
- FIGURE 37. UK EVENTS INDUSTRY MARKET, 2019-2032 ($BILLION)
- FIGURE 38. ITALY EVENTS INDUSTRY MARKET, 2019-2032 ($BILLION)
- FIGURE 39. SPAIN EVENTS INDUSTRY MARKET, 2019-2032 ($BILLION)
- FIGURE 40. RUSSIA EVENTS INDUSTRY MARKET, 2019-2032 ($BILLION)
- FIGURE 41. NETHERLANDS EVENTS INDUSTRY MARKET, 2019-2032 ($BILLION)
- FIGURE 42. SWEDEN EVENTS INDUSTRY MARKET, 2019-2032 ($BILLION)
- FIGURE 43. BELGIUM EVENTS INDUSTRY MARKET, 2019-2032 ($BILLION)
- FIGURE 44. DENMARK EVENTS INDUSTRY MARKET, 2019-2032 ($BILLION)
- FIGURE 45. FINLAND EVENTS INDUSTRY MARKET, 2019-2032 ($BILLION)
- FIGURE 46. POLAND EVENTS INDUSTRY MARKET, 2019-2032 ($BILLION)
- FIGURE 47. CZEHIA EVENTS INDUSTRY MARKET, 2019-2032 ($BILLION)
- FIGURE 48. HUNGARY EVENTS INDUSTRY MARKET, 2019-2032 ($BILLION)
- FIGURE 49. ROMANIA EVENTS INDUSTRY MARKET, 2019-2032 ($BILLION)
- FIGURE 50. REST OF EUROPE EVENTS INDUSTRY MARKET, 2019-2032 ($BILLION)
- FIGURE 51. JAPAN EVENTS INDUSTRY MARKET, 2019-2032 ($BILLION)
- FIGURE 52. CHINA EVENTS INDUSTRY MARKET, 2019-2032 ($BILLION)
- FIGURE 53. AUSTRALIA EVENTS INDUSTRY MARKET, 2019-2032 ($BILLION)
- FIGURE 54. INDIA EVENTS INDUSTRY MARKET, 2019-2032 ($BILLION)
- FIGURE 55. SINGAPORE EVENTS INDUSTRY MARKET, 2019-2032 ($BILLION)
- FIGURE 56. INDONESIA EVENTS INDUSTRY MARKET, 2019-2032 ($BILLION)
- FIGURE 57. PHILIPPINES EVENTS INDUSTRY MARKET, 2019-2032 ($BILLION)
- FIGURE 58. THAILAND EVENTS INDUSTRY MARKET, 2019-2032 ($BILLION)
- FIGURE 59. MALAYSIA EVENTS INDUSTRY MARKET, 2019-2032 ($BILLION)
- FIGURE 60. REST OF ASIA-PACIFIC EVENTS INDUSTRY MARKET, 2019-2032 ($BILLION)
- FIGURE 61. BRAZIL EVENTS INDUSTRY MARKET, 2019-2032 ($BILLION)
- FIGURE 62. ARGENTINA EVENTS INDUSTRY MARKET, 2019-2032 ($BILLION)
- FIGURE 63. SAUDI ARABIA EVENTS INDUSTRY MARKET, 2019-2032 ($BILLION)
- FIGURE 64. SOUTH AFRICA EVENTS INDUSTRY MARKET, 2019-2032 ($BILLION)
- FIGURE 65. UAE EVENTS INDUSTRY MARKET, 2019-2032 ($BILLION)
- FIGURE 66. QATAR EVENTS INDUSTRY MARKET, 2019-2032 ($BILLION)
- FIGURE 67. EGYPT EVENTS INDUSTRY MARKET, 2019-2032 ($BILLION)
- FIGURE 68. NIGERIA EVENTS INDUSTRY MARKET, 2019-2032 ($BILLION)
- FIGURE 69. REST OF LAMEA EVENTS INDUSTRY MARKET, 2019-2032 ($BILLION)
- FIGURE 70. TOP WINNING STRATEGIES, BY YEAR (2020-2023)
- FIGURE 71. TOP WINNING STRATEGIES, BY DEVELOPMENT (2020-2023)
- FIGURE 72. TOP WINNING STRATEGIES, BY COMPANY (2020-2023)
- FIGURE 73. PRODUCT MAPPING OF TOP 10 PLAYERS
- FIGURE 74. COMPETITIVE DASHBOARD
- FIGURE 75. COMPETITIVE HEATMAP: EVENTS INDUSTRY MARKET
- FIGURE 76. TOP PLAYER POSITIONING, 2019
- FIGURE 77. CAPITA PLC.: NET SALES, 2020-2022 ($MILLION)
- FIGURE 78. CAPITA PLC.: REVENUE SHARE BY REGION, 2022 (%)
- FIGURE 79. CAPITA PLC.: REVENUE SHARE BY SEGMENT, 2022 (%)
- FIGURE 80. CLARION EVENTS LIMITED: NET REVENUE, 2021-2022 ($MILLION)
- FIGURE 81. CLARION EVENTS LIMITED: REVENUE SHARE BY REGION, 2022 (%)
- FIGURE 82. CVENT HOLDING CORP.: NET SALES, 2020-2022 ($MILLION)
- FIGURE 83. CVENT HOLDING CORP.: RESEARCH & DEVELOPMENT EXPENDITURE, 2020-2022 ($MILLION)
- FIGURE 84. CVENT HOLDING CORP.: REVENUE SHARE BY REGION, 2022 (%)
According to a new report published by Allied Market Research, titled, "Events Industry Market," The events industry market was valued at $1.1 trillion in 2019, and is estimated to reach $2.1 trillion by 2032, growing at a CAGR of 6.4% from 2023 to 2032.
The global events industry market is analyzed on the basis of type, revenue source, age group, distribution channel, and region. By type, the market is divided into synthetic wigs, human hair wigs, and animal hair wigs. By application, the market is divided into personal and commercial. By distribution channel, it is classified into specialty stores, department stores, online sales channel, and others. Region wise, the market is analyzed across North America (the U.S., Canada, and Mexico), Europe (the UK, France, Italy, Spain, Germany, and the rest of Europe), Asia-Pacific (China, India, Japan, South Korea, and the rest of Asia-Pacific), and LAMEA (Brazil, South Africa, Middle East, and the rest of LAMEA).
The impact of the COVID-19 outbreak had a negative effect on the growth of the global events industry market. The restrictions and lockdown resulted in the halting of organization of events and functions, gradually impacting the overall growth of the industry. However, a recovery of the events industry market is expected in the near future owing to the rise in demand for event services from various sectors on a global scale.
The primary driving force behind the expansion of the events industry market is the substantial increase in global event sponsorships. Prominent players from various industries have made significant investments in events, such as sporting competitions and concerts, as a strategic approach to promote and create awareness about their products and services. As an effort of sponsoring these events, companies aim to leverage the wide reach and engaged audience that such gatherings attract, which ultimately results in improved brand visibility, increased customer engagement, and potential business growth opportunities. This surge in sponsorships highlights the pivotal role events play in the modern business landscape, positioning them as a key driver of market growth and competitiveness. Event sponsorship has become a critical strategic investment for businesses who seek enhanced brand visibility and targeted marketing opportunities. Companies extend financial support to events or organizations through sponsorships, thereby gaining a valuable platform to promote their products to a wide consumer audience. This strategic approach effectively enhances product acceptance among different groups of customers. Moreover, the potential for tax deductions on sponsorship expenses serves as an added incentive for businesses to capitalize on these opportunities, which helps to optimize their returns on marketing investments. In addition, event sponsorship offers a wide range of benefits that facilitate the achievement of marketing, branding, and financial objectives for businesses. It also fosters brand loyalty and allows companies to better understand and cater to consumer preferences. Furthermore, events serve as effective tools to captivate the interest of both existing and potential customers, which thus leaves a positive impression that contributes to heightened brand loyalty.
Event organization involves substantial expenditure which consists of various cost factors that contribute to the overall operational outlay. These expenses comprise on-site fees, venue costs, food and catering expenditures, event rentals, entertainment expenses, and production costs. On-site expenses refer to charges levied by the event venue, which can significantly impact the overall budget of an event. The venue costs comprise multiple components such as security deposits, room rentals, insurance coverage, and parking fees. The food and catering component encompasses the expenses associated with furnishing beverages, meals, and server wages, in addition to other relevant costs. Furthermore, a notable outlay in event management pertains to production expenditures, which consists of the strategic coordination and administration of various logistical elements, as well as endeavors to attract attendees. Thus, these expenditures collectively impose a substantial financial burden on event organizers, posing a significant obstacle to the expansion of the global event industry market.
Online booking, phone calls, emails, and video conferences have made event planning cost-effective and easily accessible. This shift has expanded the customer base through creative digital means. Smartphones, desktop apps, and mobile apps have streamlined event organization, which thus makes it more efficient and manageable. Webinars and video conferences offer seamless event experiences and create lucrative opportunities for market expansion in forthcoming years. Technology has enabled event managers to handle logistics, registration, and ticketing processes with ease, which enhances attendee experiences and satisfaction throughout the event. Real-time communication tools improve team coordination and help in the reduction of errors. Data analytics allows for better customer engagement and personalization, which significantly allows the companies to increase their brand loyalty. The trend of online events is expected to grow, and it presents businesses with opportunities to reach global audiences and foster international collaborations, thus boosting the market growth.
The major players operating in the global events industry market are Access Destination Services, BCD GROUP (BCD MEETINGS & EVENTS), ATPI Ltd., Riviera Events, Entertaining Asia, Live Nation Worldwide Inc., StubHub, Anschutz Entertainment Group, Pollstar, Cvent Inc., Capita Plc., Reed Exhibitions, Questex LLC, Outback Concerts, The Freeman Company, Penguins Limited, CL Events, Seven Events Ltd., Clarion Events Ltd., and Versatile Event Management.
Key Benefits For Stakeholders
- This report provides a quantitative analysis of the market segments, current trends, estimations, and dynamics of the events industry market analysis from 2019 to 2032 to identify the prevailing events industry market opportunities.
- The market research is offered along with information related to key drivers, restraints, and opportunities.
- Porter's five forces analysis highlights the potency of buyers and suppliers to enable stakeholders make profit-oriented business decisions and strengthen their supplier-buyer network.
- In-depth analysis of the events industry market segmentation assists to determine the prevailing market opportunities.
- Major countries in each region are mapped according to their revenue contribution to the global market.
- Market player positioning facilitates benchmarking and provides a clear understanding of the present position of the market players.
- The report includes the analysis of the regional as well as global events industry market trends, key players, market segments, application areas, and market growth strategies.
Additional benefits you will get with this purchase are:
- Quarterly Update and* (only available with a corporate license, on listed price)
- 5 additional Company Profile of client Choice pre- or Post-purchase, as a free update.
- Free Upcoming Version on the Purchase of Five and Enterprise User License.
- 16 analyst hours of support* (post-purchase, if you find additional data requirements upon review of the report, you may receive support amounting to 16 analyst hours to solve questions, and post-sale queries)
- 15% Free Customization* (in case the scope or segment of the report does not match your requirements, 20% is equivalent to 3 working days of free work, applicable once)
- Free data Pack on the Five and Enterprise User License. (Excel version of the report)
- Free Updated report if the report is 6-12 months old or older.
- 24-hour priority response*
- Free Industry updates and white papers.
Possible Customization with this report (with additional cost and timeline talk to the sales executive to know more)
- Product Life Cycles
- Average Consumer Expenditure
- Regulatory Guidelines
- Historic market data
Key Market Segments
By Type
- Music Concert
- Festivals
- Sports
- Exhibitions and Conferences
- Corporate Events and Seminars
- Others
By Revenue Source
- Ticket Sale
- Sponsorship
- Others
By Organizer
- Corporate
- Sports
- Education
- Entertainment
- Others
By Age Group
- Below 20 Years
- 21-40 Years
- Above 40 Years
By Region
- North America
- U.S.
- Canada
- Mexico
- Europe
- Germany
- France
- UK
- Italy
- Spain
- Russia
- Netherlands
- Sweden
- Belgium
- Denmark
- Finland
- Poland
- Czehia
- Hungary
- Romania
- Rest of Europe
- Asia-Pacific
- Japan
- China
- Australia
- India
- Singapore
- Indonesia
- Philippines
- Thailand
- Malaysia
- Rest of Asia-Pacific
- LAMEA
- Brazil
- Argentina
- Saudi Arabia
- South Africa
- UAE
- Qatar
- Egypt
- Nigeria
- Rest of LAMEA
Key Market Players:
- Access Destination Services, LLC
- Cvent Holding Corp.
- CL Events
- DRPG Group
- Anschutz Entertainment Group
- ATPI Ltd.
- Capita plc.
- Entertaining Asia
- BCD Group International BV
- Clarion Events Limited
TABLE OF CONTENTS
CHAPTER 1: INTRODUCTION
- 1.1. Report description
- 1.2. Key market segments
- 1.3. Key benefits to the stakeholders
- 1.4. Research Methodology
- 1.4.1. Primary research
- 1.4.2. Secondary research
- 1.4.3. Analyst tools and models
CHAPTER 2: EXECUTIVE SUMMARY
- 2.1. CXO Perspective
CHAPTER 3: MARKET OVERVIEW
- 3.1. Market definition and scope
- 3.2. Key findings
- 3.2.1. Top impacting factors
- 3.2.2. Top investment pockets
- 3.3. Porter's five forces analysis
- 3.3.1. Moderate bargaining power of suppliers
- 3.3.2. Moderate threat of new entrants
- 3.3.3. Moderate threat of substitutes
- 3.3.4. Moderate intensity of rivalry
- 3.3.5. Moderate bargaining power of buyers
- 3.4. Market dynamics
- 3.4.1. Drivers
- 3.4.1.1. Increase in sponsorship for events
- 3.4.1.2. Rise in interest among youth in entrepreneur & business seminars
- 3.4.1.3. Rise in disposable income
- 3.4.2. Restraints
- 3.4.2.1. High operational cost involved in organizing events
- 3.4.2.2. Entry barriers due to presence of existing giant players
- 3.4.3. Opportunities
- 3.4.3.1. Technological advancements
- 3.4.1. Drivers
CHAPTER 4: EVENTS INDUSTRY MARKET, BY TYPE
- 4.1. Overview
- 4.1.1. Market size and forecast
- 4.2. Music Concert
- 4.2.1. Key market trends, growth factors and opportunities
- 4.2.2. Market size and forecast, by region
- 4.2.3. Market share analysis by country
- 4.3. Festivals
- 4.3.1. Key market trends, growth factors and opportunities
- 4.3.2. Market size and forecast, by region
- 4.3.3. Market share analysis by country
- 4.4. Sports
- 4.4.1. Key market trends, growth factors and opportunities
- 4.4.2. Market size and forecast, by region
- 4.4.3. Market share analysis by country
- 4.5. Exhibitions and Conferences
- 4.5.1. Key market trends, growth factors and opportunities
- 4.5.2. Market size and forecast, by region
- 4.5.3. Market share analysis by country
- 4.6. Corporate Events and Seminars
- 4.6.1. Key market trends, growth factors and opportunities
- 4.6.2. Market size and forecast, by region
- 4.6.3. Market share analysis by country
- 4.7. Others
- 4.7.1. Key market trends, growth factors and opportunities
- 4.7.2. Market size and forecast, by region
- 4.7.3. Market share analysis by country
CHAPTER 5: EVENTS INDUSTRY MARKET, BY REVENUE SOURCE
- 5.1. Overview
- 5.1.1. Market size and forecast
- 5.2. Ticket Sale
- 5.2.1. Key market trends, growth factors and opportunities
- 5.2.2. Market size and forecast, by region
- 5.2.3. Market share analysis by country
- 5.3. Sponsorship
- 5.3.1. Key market trends, growth factors and opportunities
- 5.3.2. Market size and forecast, by region
- 5.3.3. Market share analysis by country
- 5.4. Others
- 5.4.1. Key market trends, growth factors and opportunities
- 5.4.2. Market size and forecast, by region
- 5.4.3. Market share analysis by country
CHAPTER 6: EVENTS INDUSTRY MARKET, BY ORGANIZER
- 6.1. Overview
- 6.1.1. Market size and forecast
- 6.2. Corporate
- 6.2.1. Key market trends, growth factors and opportunities
- 6.2.2. Market size and forecast, by region
- 6.2.3. Market share analysis by country
- 6.3. Sports
- 6.3.1. Key market trends, growth factors and opportunities
- 6.3.2. Market size and forecast, by region
- 6.3.3. Market share analysis by country
- 6.4. Education
- 6.4.1. Key market trends, growth factors and opportunities
- 6.4.2. Market size and forecast, by region
- 6.4.3. Market share analysis by country
- 6.5. Entertainment
- 6.5.1. Key market trends, growth factors and opportunities
- 6.5.2. Market size and forecast, by region
- 6.5.3. Market share analysis by country
- 6.6. Others
- 6.6.1. Key market trends, growth factors and opportunities
- 6.6.2. Market size and forecast, by region
- 6.6.3. Market share analysis by country
CHAPTER 7: EVENTS INDUSTRY MARKET, BY AGE GROUP
- 7.1. Overview
- 7.1.1. Market size and forecast
- 7.2. Below 20 Years
- 7.2.1. Key market trends, growth factors and opportunities
- 7.2.2. Market size and forecast, by region
- 7.2.3. Market share analysis by country
- 7.3. 21-40 Years
- 7.3.1. Key market trends, growth factors and opportunities
- 7.3.2. Market size and forecast, by region
- 7.3.3. Market share analysis by country
- 7.4. Above 40 Years
- 7.4.1. Key market trends, growth factors and opportunities
- 7.4.2. Market size and forecast, by region
- 7.4.3. Market share analysis by country
CHAPTER 8: EVENTS INDUSTRY MARKET, BY REGION
- 8.1. Overview
- 8.1.1. Market size and forecast By Region
- 8.2. North America
- 8.2.1. Key market trends, growth factors and opportunities
- 8.2.2. Market size and forecast, by Type
- 8.2.3. Market size and forecast, by Revenue Source
- 8.2.4. Market size and forecast, by Organizer
- 8.2.5. Market size and forecast, by Age Group
- 8.2.6. Market size and forecast, by country
- 8.2.6.1. U.S.
- 8.2.6.1.1. Market size and forecast, by Type
- 8.2.6.1.2. Market size and forecast, by Revenue Source
- 8.2.6.1.3. Market size and forecast, by Organizer
- 8.2.6.1.4. Market size and forecast, by Age Group
- 8.2.6.2. Canada
- 8.2.6.2.1. Market size and forecast, by Type
- 8.2.6.2.2. Market size and forecast, by Revenue Source
- 8.2.6.2.3. Market size and forecast, by Organizer
- 8.2.6.2.4. Market size and forecast, by Age Group
- 8.2.6.3. Mexico
- 8.2.6.3.1. Market size and forecast, by Type
- 8.2.6.3.2. Market size and forecast, by Revenue Source
- 8.2.6.3.3. Market size and forecast, by Organizer
- 8.2.6.3.4. Market size and forecast, by Age Group
- 8.3. Europe
- 8.3.1. Key market trends, growth factors and opportunities
- 8.3.2. Market size and forecast, by Type
- 8.3.3. Market size and forecast, by Revenue Source
- 8.3.4. Market size and forecast, by Organizer
- 8.3.5. Market size and forecast, by Age Group
- 8.3.6. Market size and forecast, by country
- 8.3.6.1. Germany
- 8.3.6.1.1. Market size and forecast, by Type
- 8.3.6.1.2. Market size and forecast, by Revenue Source
- 8.3.6.1.3. Market size and forecast, by Organizer
- 8.3.6.1.4. Market size and forecast, by Age Group
- 8.3.6.2. France
- 8.3.6.2.1. Market size and forecast, by Type
- 8.3.6.2.2. Market size and forecast, by Revenue Source
- 8.3.6.2.3. Market size and forecast, by Organizer
- 8.3.6.2.4. Market size and forecast, by Age Group
- 8.3.6.3. UK
- 8.3.6.3.1. Market size and forecast, by Type
- 8.3.6.3.2. Market size and forecast, by Revenue Source
- 8.3.6.3.3. Market size and forecast, by Organizer
- 8.3.6.3.4. Market size and forecast, by Age Group
- 8.3.6.4. Italy
- 8.3.6.4.1. Market size and forecast, by Type
- 8.3.6.4.2. Market size and forecast, by Revenue Source
- 8.3.6.4.3. Market size and forecast, by Organizer
- 8.3.6.4.4. Market size and forecast, by Age Group
- 8.3.6.5. Spain
- 8.3.6.5.1. Market size and forecast, by Type
- 8.3.6.5.2. Market size and forecast, by Revenue Source
- 8.3.6.5.3. Market size and forecast, by Organizer
- 8.3.6.5.4. Market size and forecast, by Age Group
- 8.3.6.6. Russia
- 8.3.6.6.1. Market size and forecast, by Type
- 8.3.6.6.2. Market size and forecast, by Revenue Source
- 8.3.6.6.3. Market size and forecast, by Organizer
- 8.3.6.6.4. Market size and forecast, by Age Group
- 8.3.6.7. Netherlands
- 8.3.6.7.1. Market size and forecast, by Type
- 8.3.6.7.2. Market size and forecast, by Revenue Source
- 8.3.6.7.3. Market size and forecast, by Organizer
- 8.3.6.7.4. Market size and forecast, by Age Group
- 8.3.6.8. Sweden
- 8.3.6.8.1. Market size and forecast, by Type
- 8.3.6.8.2. Market size and forecast, by Revenue Source
- 8.3.6.8.3. Market size and forecast, by Organizer
- 8.3.6.8.4. Market size and forecast, by Age Group
- 8.3.6.9. Belgium
- 8.3.6.9.1. Market size and forecast, by Type
- 8.3.6.9.2. Market size and forecast, by Revenue Source
- 8.3.6.9.3. Market size and forecast, by Organizer
- 8.3.6.9.4. Market size and forecast, by Age Group
- 8.3.6.10. Denmark
- 8.3.6.10.1. Market size and forecast, by Type
- 8.3.6.10.2. Market size and forecast, by Revenue Source
- 8.3.6.10.3. Market size and forecast, by Organizer
- 8.3.6.10.4. Market size and forecast, by Age Group
- 8.3.6.11. Finland
- 8.3.6.11.1. Market size and forecast, by Type
- 8.3.6.11.2. Market size and forecast, by Revenue Source
- 8.3.6.11.3. Market size and forecast, by Organizer
- 8.3.6.11.4. Market size and forecast, by Age Group
- 8.3.6.12. Poland
- 8.3.6.12.1. Market size and forecast, by Type
- 8.3.6.12.2. Market size and forecast, by Revenue Source
- 8.3.6.12.3. Market size and forecast, by Organizer
- 8.3.6.12.4. Market size and forecast, by Age Group
- 8.3.6.13. Czehia
- 8.3.6.13.1. Market size and forecast, by Type
- 8.3.6.13.2. Market size and forecast, by Revenue Source
- 8.3.6.13.3. Market size and forecast, by Organizer
- 8.3.6.13.4. Market size and forecast, by Age Group
- 8.3.6.14. Hungary
- 8.3.6.14.1. Market size and forecast, by Type
- 8.3.6.14.2. Market size and forecast, by Revenue Source
- 8.3.6.14.3. Market size and forecast, by Organizer
- 8.3.6.14.4. Market size and forecast, by Age Group
- 8.3.6.15. Romania
- 8.3.6.15.1. Market size and forecast, by Type
- 8.3.6.15.2. Market size and forecast, by Revenue Source
- 8.3.6.15.3. Market size and forecast, by Organizer
- 8.3.6.15.4. Market size and forecast, by Age Group
- 8.3.6.16. Rest of Europe
- 8.3.6.16.1. Market size and forecast, by Type
- 8.3.6.16.2. Market size and forecast, by Revenue Source
- 8.3.6.16.3. Market size and forecast, by Organizer
- 8.3.6.16.4. Market size and forecast, by Age Group
- 8.4. Asia-Pacific
- 8.4.1. Key market trends, growth factors and opportunities
- 8.4.2. Market size and forecast, by Type
- 8.4.3. Market size and forecast, by Revenue Source
- 8.4.4. Market size and forecast, by Organizer
- 8.4.5. Market size and forecast, by Age Group
- 8.4.6. Market size and forecast, by country
- 8.4.6.1. Japan
- 8.4.6.1.1. Market size and forecast, by Type
- 8.4.6.1.2. Market size and forecast, by Revenue Source
- 8.4.6.1.3. Market size and forecast, by Organizer
- 8.4.6.1.4. Market size and forecast, by Age Group
- 8.4.6.2. China
- 8.4.6.2.1. Market size and forecast, by Type
- 8.4.6.2.2. Market size and forecast, by Revenue Source
- 8.4.6.2.3. Market size and forecast, by Organizer
- 8.4.6.2.4. Market size and forecast, by Age Group
- 8.4.6.3. Australia
- 8.4.6.3.1. Market size and forecast, by Type
- 8.4.6.3.2. Market size and forecast, by Revenue Source
- 8.4.6.3.3. Market size and forecast, by Organizer
- 8.4.6.3.4. Market size and forecast, by Age Group
- 8.4.6.4. India
- 8.4.6.4.1. Market size and forecast, by Type
- 8.4.6.4.2. Market size and forecast, by Revenue Source
- 8.4.6.4.3. Market size and forecast, by Organizer
- 8.4.6.4.4. Market size and forecast, by Age Group
- 8.4.6.5. Singapore
- 8.4.6.5.1. Market size and forecast, by Type
- 8.4.6.5.2. Market size and forecast, by Revenue Source
- 8.4.6.5.3. Market size and forecast, by Organizer
- 8.4.6.5.4. Market size and forecast, by Age Group
- 8.4.6.6. Indonesia
- 8.4.6.6.1. Market size and forecast, by Type
- 8.4.6.6.2. Market size and forecast, by Revenue Source
- 8.4.6.6.3. Market size and forecast, by Organizer
- 8.4.6.6.4. Market size and forecast, by Age Group
- 8.4.6.7. Philippines
- 8.4.6.7.1. Market size and forecast, by Type
- 8.4.6.7.2. Market size and forecast, by Revenue Source
- 8.4.6.7.3. Market size and forecast, by Organizer
- 8.4.6.7.4. Market size and forecast, by Age Group
- 8.4.6.8. Thailand
- 8.4.6.8.1. Market size and forecast, by Type
- 8.4.6.8.2. Market size and forecast, by Revenue Source
- 8.4.6.8.3. Market size and forecast, by Organizer
- 8.4.6.8.4. Market size and forecast, by Age Group
- 8.4.6.9. Malaysia
- 8.4.6.9.1. Market size and forecast, by Type
- 8.4.6.9.2. Market size and forecast, by Revenue Source
- 8.4.6.9.3. Market size and forecast, by Organizer
- 8.4.6.9.4. Market size and forecast, by Age Group
- 8.4.6.10. Rest of Asia-Pacific
- 8.4.6.10.1. Market size and forecast, by Type
- 8.4.6.10.2. Market size and forecast, by Revenue Source
- 8.4.6.10.3. Market size and forecast, by Organizer
- 8.4.6.10.4. Market size and forecast, by Age Group
- 8.5. LAMEA
- 8.5.1. Key market trends, growth factors and opportunities
- 8.5.2. Market size and forecast, by Type
- 8.5.3. Market size and forecast, by Revenue Source
- 8.5.4. Market size and forecast, by Organizer
- 8.5.5. Market size and forecast, by Age Group
- 8.5.6. Market size and forecast, by country
- 8.5.6.1. Brazil
- 8.5.6.1.1. Market size and forecast, by Type
- 8.5.6.1.2. Market size and forecast, by Revenue Source
- 8.5.6.1.3. Market size and forecast, by Organizer
- 8.5.6.1.4. Market size and forecast, by Age Group
- 8.5.6.2. Argentina
- 8.5.6.2.1. Market size and forecast, by Type
- 8.5.6.2.2. Market size and forecast, by Revenue Source
- 8.5.6.2.3. Market size and forecast, by Organizer
- 8.5.6.2.4. Market size and forecast, by Age Group
- 8.5.6.3. Saudi Arabia
- 8.5.6.3.1. Market size and forecast, by Type
- 8.5.6.3.2. Market size and forecast, by Revenue Source
- 8.5.6.3.3. Market size and forecast, by Organizer
- 8.5.6.3.4. Market size and forecast, by Age Group
- 8.5.6.4. South Africa
- 8.5.6.4.1. Market size and forecast, by Type
- 8.5.6.4.2. Market size and forecast, by Revenue Source
- 8.5.6.4.3. Market size and forecast, by Organizer
- 8.5.6.4.4. Market size and forecast, by Age Group
- 8.5.6.5. UAE
- 8.5.6.5.1. Market size and forecast, by Type
- 8.5.6.5.2. Market size and forecast, by Revenue Source
- 8.5.6.5.3. Market size and forecast, by Organizer
- 8.5.6.5.4. Market size and forecast, by Age Group
- 8.5.6.6. Qatar
- 8.5.6.6.1. Market size and forecast, by Type
- 8.5.6.6.2. Market size and forecast, by Revenue Source
- 8.5.6.6.3. Market size and forecast, by Organizer
- 8.5.6.6.4. Market size and forecast, by Age Group
- 8.5.6.7. Egypt
- 8.5.6.7.1. Market size and forecast, by Type
- 8.5.6.7.2. Market size and forecast, by Revenue Source
- 8.5.6.7.3. Market size and forecast, by Organizer
- 8.5.6.7.4. Market size and forecast, by Age Group
- 8.5.6.8. Nigeria
- 8.5.6.8.1. Market size and forecast, by Type
- 8.5.6.8.2. Market size and forecast, by Revenue Source
- 8.5.6.8.3. Market size and forecast, by Organizer
- 8.5.6.8.4. Market size and forecast, by Age Group
- 8.5.6.9. Rest of LAMEA
- 8.5.6.9.1. Market size and forecast, by Type
- 8.5.6.9.2. Market size and forecast, by Revenue Source
- 8.5.6.9.3. Market size and forecast, by Organizer
- 8.5.6.9.4. Market size and forecast, by Age Group
CHAPTER 9: COMPETITIVE LANDSCAPE
- 9.1. Introduction
- 9.2. Top winning strategies
- 9.3. Product Mapping of Top 10 Player
- 9.4. Competitive Dashboard
- 9.5. Competitive Heatmap
- 9.6. Top player positioning, 2019
CHAPTER 10: COMPANY PROFILES
- 10.1. Anschutz Entertainment Group
- 10.1.1. Company overview
- 10.1.2. Key Executives
- 10.1.3. Company snapshot
- 10.1.4. Operating business segments
- 10.1.5. Product portfolio
- 10.1.6. Key strategic moves and developments
- 10.2. Access Destination Services, LLC
- 10.2.1. Company overview
- 10.2.2. Key Executives
- 10.2.3. Company snapshot
- 10.2.4. Operating business segments
- 10.2.5. Product portfolio
- 10.2.6. Key strategic moves and developments
- 10.3. BCD Group International BV
- 10.3.1. Company overview
- 10.3.2. Key Executives
- 10.3.3. Company snapshot
- 10.3.4. Operating business segments
- 10.3.5. Product portfolio
- 10.3.6. Key strategic moves and developments
- 10.4. Capita plc.
- 10.4.1. Company overview
- 10.4.2. Key Executives
- 10.4.3. Company snapshot
- 10.4.4. Operating business segments
- 10.4.5. Product portfolio
- 10.4.6. Business performance
- 10.5. CL Events
- 10.5.1. Company overview
- 10.5.2. Key Executives
- 10.5.3. Company snapshot
- 10.5.4. Operating business segments
- 10.5.5. Product portfolio
- 10.6. Clarion Events Limited
- 10.6.1. Company overview
- 10.6.2. Key Executives
- 10.6.3. Company snapshot
- 10.6.4. Operating business segments
- 10.6.5. Product portfolio
- 10.6.6. Business performance
- 10.6.7. Key strategic moves and developments
- 10.7. Cvent Holding Corp.
- 10.7.1. Company overview
- 10.7.2. Key Executives
- 10.7.3. Company snapshot
- 10.7.4. Operating business segments
- 10.7.5. Product portfolio
- 10.7.6. Business performance
- 10.7.7. Key strategic moves and developments
- 10.8. DRPG Group
- 10.8.1. Company overview
- 10.8.2. Key Executives
- 10.8.3. Company snapshot
- 10.8.4. Operating business segments
- 10.8.5. Product portfolio
- 10.9. Entertaining Asia
- 10.9.1. Company overview
- 10.9.2. Key Executives
- 10.9.3. Company snapshot
- 10.9.4. Operating business segments
- 10.9.5. Product portfolio
- 10.10. ATPI Ltd.
- 10.10.1. Company overview
- 10.10.2. Key Executives
- 10.10.3. Company snapshot
- 10.10.4. Operating business segments
- 10.10.5. Product portfolio
- 10.10.6. Key strategic moves and developments