 |
市場調査レポート
商品コード
1365705
世界の自然言語処理市場:コンポーネント別、導入形態別、企業規模別、タイプ別、業界別:世界の機会分析と産業予測、2023~2032年World Natural Language Processing Market By Component, By Deployment Mode, By Enterprise Size, By Type, By Industry Vertical : Global Opportunity Analysis and Industry Forecast, 2023-2032 |
||||||

| 世界の自然言語処理市場:コンポーネント別、導入形態別、企業規模別、タイプ別、業界別:世界の機会分析と産業予測、2023~2032年 |
|
出版日: 2023年08月01日
発行: Allied Market Research
ページ情報: 英文 425 Pages
納期: 2~3営業日
|
- 全表示
- 概要
- 図表
- 目次
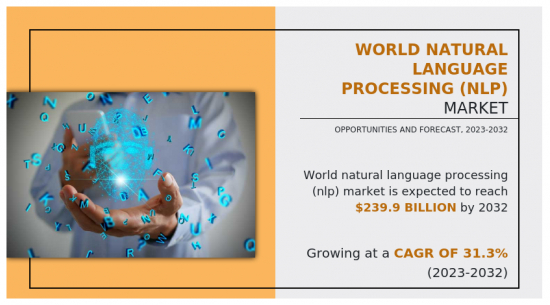
世界の自然言語処理市場は、2022年に162億米ドルと評価され、2023年から2032年にかけてCAGR 31.3%で成長し、2032年には2,399億米ドルに達すると推定されます。
ディープラーニング(DL)や機械学習(ML)と自然言語処理の統合による自動化の進展が、市場成長の原動力となっています。また、スマートデバイスの需要拡大、高度なテキスト分析の需要増加が市場の成長を促進します。しかし、自然言語処理ソリューションの実装時のコード混在言語の使用による複雑さが、市場の成長を妨げると予想されます。さらに、自然言語処理とディープラーニングや機械学習(ML)の統合による自動化の増加や、医療分野への投資の増加は、市場に有利な成長機会をもたらすと期待されています。
導入形態別では、オンプレミスセグメンテーションが2022年の自然言語処理市場を独占し、データに対する完全な制御と可視性を提供し、強力な認証セキュリティ対策が市場成長を大きく後押しするため、今後も優位性を維持すると予想されます。しかし、サービス分野は、導入コストの低減、予測可能なランニングコスト、AI駆動型自然言語処理における柔軟性と拡大性の向上、システムダウンタイムのリスク低減により、最も高い成長が見込まれています。
地域別では、2021年の自然言語処理市場規模は北米が独占しており、クラウドコンピューティング、AI、MLなどの先進的な最新技術の採用と成長の増加、ビジネスと顧客体験を向上させるためのBFSI、IT、政府部門における自然言語処理の利用増加により、予測期間中もその地位を維持すると予想されます。しかし、アジア太平洋は、顧客エンゲージメントを強化し、ITインフラストラクチャの有効性を高めるために、すべての業界の垂直全体でプロセス自動化の採用により、予測期間中に大きな成長を示すと予想され、この地域の市場成長を促進することが期待されています。さらに、Apple Inc.、Intel Corporation、Google LLC、Microsoft Corporation、Oracle Corporation、International Business Machines Corporation、Amazon Web Services, Inc.など、複数の主要な自然言語処理ソリューションプロバイダーが、自然言語処理に新しい製品やサービスを導入しています。
本レポートは、自然言語処理市場の成長見通し、市場抑制要因、動向分析に焦点を当てています。供給企業の交渉力、競合企業の競争力、新規参入業者の脅威、代替品の脅威、買い手の交渉力など、数多くの要因が自然言語処理市場シェアに与える影響を把握するため、ポーターのファイブフォース分析を提供しています。
セグメントレビュー
目次
第1章 イントロダクション
第2章 エグゼクティブサマリー
第3章 市場概要
- 市場の定義と範囲
- 主な調査結果
- 影響要因
- 主な投資機会
- ポーターのファイブフォース分析
- 市場力学
- 促進要因
- 自然言語処理とディープラーニング(DL)および機械学習(ML)の統合による自動化の増加
- インターネットとコネクテッドデバイスの利用拡大
- リスクを低減し成長機会を特定するための予測分析に対する需要の高まり
- 抑制要因
- 自然言語処理ソリューションの実装におけるコード混合言語の使用による複雑さ
- 熟練労働者の不足と信頼性の問題
- 機会
- 地理的拡大によるビジネスモデル技術の急速な変化
- 顧客体験を向上させるために、業界全体で自然言語処理ベースのアプリケーションの採用が拡大
- 促進要因
- COVID-19市場への影響分析
第4章 世界の自然言語処理市場:コンポーネント別
- 概要
- ソリューション
- サービス
第5章 世界の自然言語処理市場:導入形態別
- 概要
- オンプレミス
- クラウド
第6章 世界の自然言語処理市場:企業規模別
- 概要
- 大企業
- 中小企業
第7章 世界の自然言語処理市場:タイプ別
- 概要
- 統計的自然言語処理
- ルールベース自然言語処理
- ハイブリッド自然言語処理
第8章 世界の自然言語処理市場:業界別
- 概要
- BFSI
- IT・通信
- 小売・eコマース
- 医療
- 教育
- メディア・娯楽
- その他
第9章 世界の自然言語処理市場:地域別
- 概要
- 北米
- 米国
- カナダ
- 欧州
- 英国
- ドイツ
- フランス
- イタリア
- スペイン
- その他
- アジア太平洋
- 中国
- 日本
- インド
- オーストラリア
- 韓国
- その他
- ラテンアメリカ
- ラテンアメリカ
- 中東
- アフリカ
第10章 競合情勢
- イントロダクション
- 主要成功戦略
- 主要10社の製品マッピング
- 競合ダッシュボード
- 競合ヒートマップ
- 主要企業のポジショニング、2022年
第11章 企業プロファイル
- Apple Inc.
- Intel Corporation
- SAS Institute Inc.
- SAP SE
- Google LLC
- Microsoft Corporation
- Oracle Corporation
- International Business Machines Corporation
- Amazon Web Services, Inc.
- Hewlett Packard Enterprise Development LP
LIST OF TABLES
- TABLE 01. GLOBAL WORLD NATURAL LANGUAGE PROCESSING (NLP) MARKET, BY COMPONENT, 2022-2032 ($MILLION)
- TABLE 02. WORLD NATURAL LANGUAGE PROCESSING (NLP) MARKET FOR SOLUTION, BY REGION, 2022-2032 ($MILLION)
- TABLE 03. WORLD NATURAL LANGUAGE PROCESSING (NLP) MARKET FOR SERVICE, BY REGION, 2022-2032 ($MILLION)
- TABLE 04. GLOBAL WORLD NATURAL LANGUAGE PROCESSING (NLP) MARKET, BY DEPLOYMENT MODE, 2022-2032 ($MILLION)
- TABLE 05. WORLD NATURAL LANGUAGE PROCESSING (NLP) MARKET FOR ON-PREMISE, BY REGION, 2022-2032 ($MILLION)
- TABLE 06. WORLD NATURAL LANGUAGE PROCESSING (NLP) MARKET FOR CLOUD, BY REGION, 2022-2032 ($MILLION)
- TABLE 07. GLOBAL WORLD NATURAL LANGUAGE PROCESSING (NLP) MARKET, BY ENTERPRISE SIZE, 2022-2032 ($MILLION)
- TABLE 08. WORLD NATURAL LANGUAGE PROCESSING (NLP) MARKET FOR LARGE ENTERPRISE, BY REGION, 2022-2032 ($MILLION)
- TABLE 09. WORLD NATURAL LANGUAGE PROCESSING (NLP) MARKET FOR SMALL AND MEDIUM-SIZED ENTERPRISE, BY REGION, 2022-2032 ($MILLION)
- TABLE 10. GLOBAL WORLD NATURAL LANGUAGE PROCESSING (NLP) MARKET, BY TYPE, 2022-2032 ($MILLION)
- TABLE 11. WORLD NATURAL LANGUAGE PROCESSING (NLP) MARKET FOR STATISTICAL NLP, BY REGION, 2022-2032 ($MILLION)
- TABLE 12. WORLD NATURAL LANGUAGE PROCESSING (NLP) MARKET FOR RULE-BASED NLP, BY REGION, 2022-2032 ($MILLION)
- TABLE 13. WORLD NATURAL LANGUAGE PROCESSING (NLP) MARKET FOR HYBRID NLP, BY REGION, 2022-2032 ($MILLION)
- TABLE 14. GLOBAL WORLD NATURAL LANGUAGE PROCESSING (NLP) MARKET, BY INDUSTRY VERTICAL, 2022-2032 ($MILLION)
- TABLE 15. WORLD NATURAL LANGUAGE PROCESSING (NLP) MARKET FOR BFSI, BY REGION, 2022-2032 ($MILLION)
- TABLE 16. WORLD NATURAL LANGUAGE PROCESSING (NLP) MARKET FOR IT AND TELECOM, BY REGION, 2022-2032 ($MILLION)
- TABLE 17. WORLD NATURAL LANGUAGE PROCESSING (NLP) MARKET FOR RETAIL AND E-COMMERCE, BY REGION, 2022-2032 ($MILLION)
- TABLE 18. WORLD NATURAL LANGUAGE PROCESSING (NLP) MARKET FOR HEALTHCARE, BY REGION, 2022-2032 ($MILLION)
- TABLE 19. WORLD NATURAL LANGUAGE PROCESSING (NLP) MARKET FOR EDUCATION, BY REGION, 2022-2032 ($MILLION)
- TABLE 20. WORLD NATURAL LANGUAGE PROCESSING (NLP) MARKET FOR MEDIA AND ENTERTAINMENT, BY REGION, 2022-2032 ($MILLION)
- TABLE 21. WORLD NATURAL LANGUAGE PROCESSING (NLP) MARKET FOR OTHERS, BY REGION, 2022-2032 ($MILLION)
- TABLE 22. WORLD NATURAL LANGUAGE PROCESSING (NLP) MARKET, BY REGION, 2022-2032 ($MILLION)
- TABLE 23. NORTH AMERICA WORLD NATURAL LANGUAGE PROCESSING (NLP) MARKET, BY COMPONENT, 2022-2032 ($MILLION)
- TABLE 24. NORTH AMERICA WORLD NATURAL LANGUAGE PROCESSING (NLP) MARKET, BY DEPLOYMENT MODE, 2022-2032 ($MILLION)
- TABLE 25. NORTH AMERICA WORLD NATURAL LANGUAGE PROCESSING (NLP) MARKET, BY ENTERPRISE SIZE, 2022-2032 ($MILLION)
- TABLE 26. NORTH AMERICA WORLD NATURAL LANGUAGE PROCESSING (NLP) MARKET, BY TYPE, 2022-2032 ($MILLION)
- TABLE 27. NORTH AMERICA WORLD NATURAL LANGUAGE PROCESSING (NLP) MARKET, BY INDUSTRY VERTICAL, 2022-2032 ($MILLION)
- TABLE 28. NORTH AMERICA WORLD NATURAL LANGUAGE PROCESSING (NLP) MARKET, BY COUNTRY, 2022-2032 ($MILLION)
- TABLE 29. U.S. WORLD NATURAL LANGUAGE PROCESSING (NLP) MARKET, BY COMPONENT, 2022-2032 ($MILLION)
- TABLE 30. U.S. WORLD NATURAL LANGUAGE PROCESSING (NLP) MARKET, BY DEPLOYMENT MODE, 2022-2032 ($MILLION)
- TABLE 31. U.S. WORLD NATURAL LANGUAGE PROCESSING (NLP) MARKET, BY ENTERPRISE SIZE, 2022-2032 ($MILLION)
- TABLE 32. U.S. WORLD NATURAL LANGUAGE PROCESSING (NLP) MARKET, BY TYPE, 2022-2032 ($MILLION)
- TABLE 33. U.S. WORLD NATURAL LANGUAGE PROCESSING (NLP) MARKET, BY INDUSTRY VERTICAL, 2022-2032 ($MILLION)
- TABLE 34. CANADA WORLD NATURAL LANGUAGE PROCESSING (NLP) MARKET, BY COMPONENT, 2022-2032 ($MILLION)
- TABLE 35. CANADA WORLD NATURAL LANGUAGE PROCESSING (NLP) MARKET, BY DEPLOYMENT MODE, 2022-2032 ($MILLION)
- TABLE 36. CANADA WORLD NATURAL LANGUAGE PROCESSING (NLP) MARKET, BY ENTERPRISE SIZE, 2022-2032 ($MILLION)
- TABLE 37. CANADA WORLD NATURAL LANGUAGE PROCESSING (NLP) MARKET, BY TYPE, 2022-2032 ($MILLION)
- TABLE 38. CANADA WORLD NATURAL LANGUAGE PROCESSING (NLP) MARKET, BY INDUSTRY VERTICAL, 2022-2032 ($MILLION)
- TABLE 39. EUROPE WORLD NATURAL LANGUAGE PROCESSING (NLP) MARKET, BY COMPONENT, 2022-2032 ($MILLION)
- TABLE 40. EUROPE WORLD NATURAL LANGUAGE PROCESSING (NLP) MARKET, BY DEPLOYMENT MODE, 2022-2032 ($MILLION)
- TABLE 41. EUROPE WORLD NATURAL LANGUAGE PROCESSING (NLP) MARKET, BY ENTERPRISE SIZE, 2022-2032 ($MILLION)
- TABLE 42. EUROPE WORLD NATURAL LANGUAGE PROCESSING (NLP) MARKET, BY TYPE, 2022-2032 ($MILLION)
- TABLE 43. EUROPE WORLD NATURAL LANGUAGE PROCESSING (NLP) MARKET, BY INDUSTRY VERTICAL, 2022-2032 ($MILLION)
- TABLE 44. EUROPE WORLD NATURAL LANGUAGE PROCESSING (NLP) MARKET, BY COUNTRY, 2022-2032 ($MILLION)
- TABLE 45. UK WORLD NATURAL LANGUAGE PROCESSING (NLP) MARKET, BY COMPONENT, 2022-2032 ($MILLION)
- TABLE 46. UK WORLD NATURAL LANGUAGE PROCESSING (NLP) MARKET, BY DEPLOYMENT MODE, 2022-2032 ($MILLION)
- TABLE 47. UK WORLD NATURAL LANGUAGE PROCESSING (NLP) MARKET, BY ENTERPRISE SIZE, 2022-2032 ($MILLION)
- TABLE 48. UK WORLD NATURAL LANGUAGE PROCESSING (NLP) MARKET, BY TYPE, 2022-2032 ($MILLION)
- TABLE 49. UK WORLD NATURAL LANGUAGE PROCESSING (NLP) MARKET, BY INDUSTRY VERTICAL, 2022-2032 ($MILLION)
- TABLE 50. GERMANY WORLD NATURAL LANGUAGE PROCESSING (NLP) MARKET, BY COMPONENT, 2022-2032 ($MILLION)
- TABLE 51. GERMANY WORLD NATURAL LANGUAGE PROCESSING (NLP) MARKET, BY DEPLOYMENT MODE, 2022-2032 ($MILLION)
- TABLE 52. GERMANY WORLD NATURAL LANGUAGE PROCESSING (NLP) MARKET, BY ENTERPRISE SIZE, 2022-2032 ($MILLION)
- TABLE 53. GERMANY WORLD NATURAL LANGUAGE PROCESSING (NLP) MARKET, BY TYPE, 2022-2032 ($MILLION)
- TABLE 54. GERMANY WORLD NATURAL LANGUAGE PROCESSING (NLP) MARKET, BY INDUSTRY VERTICAL, 2022-2032 ($MILLION)
- TABLE 55. FRANCE WORLD NATURAL LANGUAGE PROCESSING (NLP) MARKET, BY COMPONENT, 2022-2032 ($MILLION)
- TABLE 56. FRANCE WORLD NATURAL LANGUAGE PROCESSING (NLP) MARKET, BY DEPLOYMENT MODE, 2022-2032 ($MILLION)
- TABLE 57. FRANCE WORLD NATURAL LANGUAGE PROCESSING (NLP) MARKET, BY ENTERPRISE SIZE, 2022-2032 ($MILLION)
- TABLE 58. FRANCE WORLD NATURAL LANGUAGE PROCESSING (NLP) MARKET, BY TYPE, 2022-2032 ($MILLION)
- TABLE 59. FRANCE WORLD NATURAL LANGUAGE PROCESSING (NLP) MARKET, BY INDUSTRY VERTICAL, 2022-2032 ($MILLION)
- TABLE 60. ITALY WORLD NATURAL LANGUAGE PROCESSING (NLP) MARKET, BY COMPONENT, 2022-2032 ($MILLION)
- TABLE 61. ITALY WORLD NATURAL LANGUAGE PROCESSING (NLP) MARKET, BY DEPLOYMENT MODE, 2022-2032 ($MILLION)
- TABLE 62. ITALY WORLD NATURAL LANGUAGE PROCESSING (NLP) MARKET, BY ENTERPRISE SIZE, 2022-2032 ($MILLION)
- TABLE 63. ITALY WORLD NATURAL LANGUAGE PROCESSING (NLP) MARKET, BY TYPE, 2022-2032 ($MILLION)
- TABLE 64. ITALY WORLD NATURAL LANGUAGE PROCESSING (NLP) MARKET, BY INDUSTRY VERTICAL, 2022-2032 ($MILLION)
- TABLE 65. SPAIN WORLD NATURAL LANGUAGE PROCESSING (NLP) MARKET, BY COMPONENT, 2022-2032 ($MILLION)
- TABLE 66. SPAIN WORLD NATURAL LANGUAGE PROCESSING (NLP) MARKET, BY DEPLOYMENT MODE, 2022-2032 ($MILLION)
- TABLE 67. SPAIN WORLD NATURAL LANGUAGE PROCESSING (NLP) MARKET, BY ENTERPRISE SIZE, 2022-2032 ($MILLION)
- TABLE 68. SPAIN WORLD NATURAL LANGUAGE PROCESSING (NLP) MARKET, BY TYPE, 2022-2032 ($MILLION)
- TABLE 69. SPAIN WORLD NATURAL LANGUAGE PROCESSING (NLP) MARKET, BY INDUSTRY VERTICAL, 2022-2032 ($MILLION)
- TABLE 70. REST OF EUROPE WORLD NATURAL LANGUAGE PROCESSING (NLP) MARKET, BY COMPONENT, 2022-2032 ($MILLION)
- TABLE 71. REST OF EUROPE WORLD NATURAL LANGUAGE PROCESSING (NLP) MARKET, BY DEPLOYMENT MODE, 2022-2032 ($MILLION)
- TABLE 72. REST OF EUROPE WORLD NATURAL LANGUAGE PROCESSING (NLP) MARKET, BY ENTERPRISE SIZE, 2022-2032 ($MILLION)
- TABLE 73. REST OF EUROPE WORLD NATURAL LANGUAGE PROCESSING (NLP) MARKET, BY TYPE, 2022-2032 ($MILLION)
- TABLE 74. REST OF EUROPE WORLD NATURAL LANGUAGE PROCESSING (NLP) MARKET, BY INDUSTRY VERTICAL, 2022-2032 ($MILLION)
- TABLE 75. ASIA-PACIFIC WORLD NATURAL LANGUAGE PROCESSING (NLP) MARKET, BY COMPONENT, 2022-2032 ($MILLION)
- TABLE 76. ASIA-PACIFIC WORLD NATURAL LANGUAGE PROCESSING (NLP) MARKET, BY DEPLOYMENT MODE, 2022-2032 ($MILLION)
- TABLE 77. ASIA-PACIFIC WORLD NATURAL LANGUAGE PROCESSING (NLP) MARKET, BY ENTERPRISE SIZE, 2022-2032 ($MILLION)
- TABLE 78. ASIA-PACIFIC WORLD NATURAL LANGUAGE PROCESSING (NLP) MARKET, BY TYPE, 2022-2032 ($MILLION)
- TABLE 79. ASIA-PACIFIC WORLD NATURAL LANGUAGE PROCESSING (NLP) MARKET, BY INDUSTRY VERTICAL, 2022-2032 ($MILLION)
- TABLE 80. ASIA-PACIFIC WORLD NATURAL LANGUAGE PROCESSING (NLP) MARKET, BY COUNTRY, 2022-2032 ($MILLION)
- TABLE 81. CHINA WORLD NATURAL LANGUAGE PROCESSING (NLP) MARKET, BY COMPONENT, 2022-2032 ($MILLION)
- TABLE 82. CHINA WORLD NATURAL LANGUAGE PROCESSING (NLP) MARKET, BY DEPLOYMENT MODE, 2022-2032 ($MILLION)
- TABLE 83. CHINA WORLD NATURAL LANGUAGE PROCESSING (NLP) MARKET, BY ENTERPRISE SIZE, 2022-2032 ($MILLION)
- TABLE 84. CHINA WORLD NATURAL LANGUAGE PROCESSING (NLP) MARKET, BY TYPE, 2022-2032 ($MILLION)
- TABLE 85. CHINA WORLD NATURAL LANGUAGE PROCESSING (NLP) MARKET, BY INDUSTRY VERTICAL, 2022-2032 ($MILLION)
- TABLE 86. JAPAN WORLD NATURAL LANGUAGE PROCESSING (NLP) MARKET, BY COMPONENT, 2022-2032 ($MILLION)
- TABLE 87. JAPAN WORLD NATURAL LANGUAGE PROCESSING (NLP) MARKET, BY DEPLOYMENT MODE, 2022-2032 ($MILLION)
- TABLE 88. JAPAN WORLD NATURAL LANGUAGE PROCESSING (NLP) MARKET, BY ENTERPRISE SIZE, 2022-2032 ($MILLION)
- TABLE 89. JAPAN WORLD NATURAL LANGUAGE PROCESSING (NLP) MARKET, BY TYPE, 2022-2032 ($MILLION)
- TABLE 90. JAPAN WORLD NATURAL LANGUAGE PROCESSING (NLP) MARKET, BY INDUSTRY VERTICAL, 2022-2032 ($MILLION)
- TABLE 91. INDIA WORLD NATURAL LANGUAGE PROCESSING (NLP) MARKET, BY COMPONENT, 2022-2032 ($MILLION)
- TABLE 92. INDIA WORLD NATURAL LANGUAGE PROCESSING (NLP) MARKET, BY DEPLOYMENT MODE, 2022-2032 ($MILLION)
- TABLE 93. INDIA WORLD NATURAL LANGUAGE PROCESSING (NLP) MARKET, BY ENTERPRISE SIZE, 2022-2032 ($MILLION)
- TABLE 94. INDIA WORLD NATURAL LANGUAGE PROCESSING (NLP) MARKET, BY TYPE, 2022-2032 ($MILLION)
- TABLE 95. INDIA WORLD NATURAL LANGUAGE PROCESSING (NLP) MARKET, BY INDUSTRY VERTICAL, 2022-2032 ($MILLION)
- TABLE 96. AUSTRALIA WORLD NATURAL LANGUAGE PROCESSING (NLP) MARKET, BY COMPONENT, 2022-2032 ($MILLION)
- TABLE 97. AUSTRALIA WORLD NATURAL LANGUAGE PROCESSING (NLP) MARKET, BY DEPLOYMENT MODE, 2022-2032 ($MILLION)
- TABLE 98. AUSTRALIA WORLD NATURAL LANGUAGE PROCESSING (NLP) MARKET, BY ENTERPRISE SIZE, 2022-2032 ($MILLION)
- TABLE 99. AUSTRALIA WORLD NATURAL LANGUAGE PROCESSING (NLP) MARKET, BY TYPE, 2022-2032 ($MILLION)
- TABLE 100. AUSTRALIA WORLD NATURAL LANGUAGE PROCESSING (NLP) MARKET, BY INDUSTRY VERTICAL, 2022-2032 ($MILLION)
- TABLE 101. SOUTH KOREA WORLD NATURAL LANGUAGE PROCESSING (NLP) MARKET, BY COMPONENT, 2022-2032 ($MILLION)
- TABLE 102. SOUTH KOREA WORLD NATURAL LANGUAGE PROCESSING (NLP) MARKET, BY DEPLOYMENT MODE, 2022-2032 ($MILLION)
- TABLE 103. SOUTH KOREA WORLD NATURAL LANGUAGE PROCESSING (NLP) MARKET, BY ENTERPRISE SIZE, 2022-2032 ($MILLION)
- TABLE 104. SOUTH KOREA WORLD NATURAL LANGUAGE PROCESSING (NLP) MARKET, BY TYPE, 2022-2032 ($MILLION)
- TABLE 105. SOUTH KOREA WORLD NATURAL LANGUAGE PROCESSING (NLP) MARKET, BY INDUSTRY VERTICAL, 2022-2032 ($MILLION)
- TABLE 106. REST OF ASIA-PACIFIC WORLD NATURAL LANGUAGE PROCESSING (NLP) MARKET, BY COMPONENT, 2022-2032 ($MILLION)
- TABLE 107. REST OF ASIA-PACIFIC WORLD NATURAL LANGUAGE PROCESSING (NLP) MARKET, BY DEPLOYMENT MODE, 2022-2032 ($MILLION)
- TABLE 108. REST OF ASIA-PACIFIC WORLD NATURAL LANGUAGE PROCESSING (NLP) MARKET, BY ENTERPRISE SIZE, 2022-2032 ($MILLION)
- TABLE 109. REST OF ASIA-PACIFIC WORLD NATURAL LANGUAGE PROCESSING (NLP) MARKET, BY TYPE, 2022-2032 ($MILLION)
- TABLE 110. REST OF ASIA-PACIFIC WORLD NATURAL LANGUAGE PROCESSING (NLP) MARKET, BY INDUSTRY VERTICAL, 2022-2032 ($MILLION)
- TABLE 111. LAMEA WORLD NATURAL LANGUAGE PROCESSING (NLP) MARKET, BY COMPONENT, 2022-2032 ($MILLION)
- TABLE 112. LAMEA WORLD NATURAL LANGUAGE PROCESSING (NLP) MARKET, BY DEPLOYMENT MODE, 2022-2032 ($MILLION)
- TABLE 113. LAMEA WORLD NATURAL LANGUAGE PROCESSING (NLP) MARKET, BY ENTERPRISE SIZE, 2022-2032 ($MILLION)
- TABLE 114. LAMEA WORLD NATURAL LANGUAGE PROCESSING (NLP) MARKET, BY TYPE, 2022-2032 ($MILLION)
- TABLE 115. LAMEA WORLD NATURAL LANGUAGE PROCESSING (NLP) MARKET, BY INDUSTRY VERTICAL, 2022-2032 ($MILLION)
- TABLE 116. LAMEA WORLD NATURAL LANGUAGE PROCESSING (NLP) MARKET, BY COUNTRY, 2022-2032 ($MILLION)
- TABLE 117. LATIN AMERICA WORLD NATURAL LANGUAGE PROCESSING (NLP) MARKET, BY COMPONENT, 2022-2032 ($MILLION)
- TABLE 118. LATIN AMERICA WORLD NATURAL LANGUAGE PROCESSING (NLP) MARKET, BY DEPLOYMENT MODE, 2022-2032 ($MILLION)
- TABLE 119. LATIN AMERICA WORLD NATURAL LANGUAGE PROCESSING (NLP) MARKET, BY ENTERPRISE SIZE, 2022-2032 ($MILLION)
- TABLE 120. LATIN AMERICA WORLD NATURAL LANGUAGE PROCESSING (NLP) MARKET, BY TYPE, 2022-2032 ($MILLION)
- TABLE 121. LATIN AMERICA WORLD NATURAL LANGUAGE PROCESSING (NLP) MARKET, BY INDUSTRY VERTICAL, 2022-2032 ($MILLION)
- TABLE 122. MIDDLE EAST WORLD NATURAL LANGUAGE PROCESSING (NLP) MARKET, BY COMPONENT, 2022-2032 ($MILLION)
- TABLE 123. MIDDLE EAST WORLD NATURAL LANGUAGE PROCESSING (NLP) MARKET, BY DEPLOYMENT MODE, 2022-2032 ($MILLION)
- TABLE 124. MIDDLE EAST WORLD NATURAL LANGUAGE PROCESSING (NLP) MARKET, BY ENTERPRISE SIZE, 2022-2032 ($MILLION)
- TABLE 125. MIDDLE EAST WORLD NATURAL LANGUAGE PROCESSING (NLP) MARKET, BY TYPE, 2022-2032 ($MILLION)
- TABLE 126. MIDDLE EAST WORLD NATURAL LANGUAGE PROCESSING (NLP) MARKET, BY INDUSTRY VERTICAL, 2022-2032 ($MILLION)
- TABLE 127. AFRICA WORLD NATURAL LANGUAGE PROCESSING (NLP) MARKET, BY COMPONENT, 2022-2032 ($MILLION)
- TABLE 128. AFRICA WORLD NATURAL LANGUAGE PROCESSING (NLP) MARKET, BY DEPLOYMENT MODE, 2022-2032 ($MILLION)
- TABLE 129. AFRICA WORLD NATURAL LANGUAGE PROCESSING (NLP) MARKET, BY ENTERPRISE SIZE, 2022-2032 ($MILLION)
- TABLE 130. AFRICA WORLD NATURAL LANGUAGE PROCESSING (NLP) MARKET, BY TYPE, 2022-2032 ($MILLION)
- TABLE 131. AFRICA WORLD NATURAL LANGUAGE PROCESSING (NLP) MARKET, BY INDUSTRY VERTICAL, 2022-2032 ($MILLION)
- TABLE 132. APPLE INC.: KEY EXECUTIVES
- TABLE 133. APPLE INC.: COMPANY SNAPSHOT
- TABLE 134. APPLE INC.: SERVICE SEGMENTS
- TABLE 135. APPLE INC.: PRODUCT PORTFOLIO
- TABLE 136. APPLE INC.: KEY STRATERGIES
- TABLE 137. INTEL CORPORATION: KEY EXECUTIVES
- TABLE 138. INTEL CORPORATION: COMPANY SNAPSHOT
- TABLE 139. INTEL CORPORATION: PRODUCT SEGMENTS
- TABLE 140. INTEL CORPORATION: PRODUCT PORTFOLIO
- TABLE 141. INTEL CORPORATION: KEY STRATERGIES
- TABLE 142. SAS INSTITUTE INC.: KEY EXECUTIVES
- TABLE 143. SAS INSTITUTE INC.: COMPANY SNAPSHOT
- TABLE 144. SAS INSTITUTE INC.: PRODUCT SEGMENTS
- TABLE 145. SAS INSTITUTE INC.: PRODUCT PORTFOLIO
- TABLE 146. SAS INSTITUTE INC.: KEY STRATERGIES
- TABLE 147. SAP SE: KEY EXECUTIVES
- TABLE 148. SAP SE: COMPANY SNAPSHOT
- TABLE 149. SAP SE: SERVICE SEGMENTS
- TABLE 150. SAP SE: PRODUCT PORTFOLIO
- TABLE 151. SAP SE: KEY STRATERGIES
- TABLE 152. GOOGLE LLC: KEY EXECUTIVES
- TABLE 153. GOOGLE LLC: COMPANY SNAPSHOT
- TABLE 154. GOOGLE LLC: SERVICE SEGMENTS
- TABLE 155. GOOGLE LLC: PRODUCT PORTFOLIO
- TABLE 156. GOOGLE LLC: KEY STRATERGIES
- TABLE 157. MICROSOFT CORPORATION: KEY EXECUTIVES
- TABLE 158. MICROSOFT CORPORATION: COMPANY SNAPSHOT
- TABLE 159. MICROSOFT CORPORATION: SERVICE SEGMENTS
- TABLE 160. MICROSOFT CORPORATION: PRODUCT PORTFOLIO
- TABLE 161. MICROSOFT CORPORATION: KEY STRATERGIES
- TABLE 162. ORACLE CORPORATION: KEY EXECUTIVES
- TABLE 163. ORACLE CORPORATION: COMPANY SNAPSHOT
- TABLE 164. ORACLE CORPORATION: SERVICE SEGMENTS
- TABLE 165. ORACLE CORPORATION: PRODUCT PORTFOLIO
- TABLE 166. ORACLE CORPORATION: KEY STRATERGIES
- TABLE 167. INTERNATIONAL BUSINESS MACHINES CORPORATION: KEY EXECUTIVES
- TABLE 168. INTERNATIONAL BUSINESS MACHINES CORPORATION: COMPANY SNAPSHOT
- TABLE 169. INTERNATIONAL BUSINESS MACHINES CORPORATION: SERVICE SEGMENTS
- TABLE 170. INTERNATIONAL BUSINESS MACHINES CORPORATION: PRODUCT PORTFOLIO
- TABLE 171. INTERNATIONAL BUSINESS MACHINES CORPORATION: KEY STRATERGIES
- TABLE 172. AMAZON WEB SERVICES, INC.: KEY EXECUTIVES
- TABLE 173. AMAZON WEB SERVICES, INC.: COMPANY SNAPSHOT
- TABLE 174. AMAZON WEB SERVICES, INC.: SERVICE SEGMENTS
- TABLE 175. AMAZON WEB SERVICES, INC.: PRODUCT PORTFOLIO
- TABLE 176. AMAZON WEB SERVICES, INC.: KEY STRATERGIES
- TABLE 177. HEWLETT PACKARD ENTERPRISE DEVELOPMENT LP: KEY EXECUTIVES
- TABLE 178. HEWLETT PACKARD ENTERPRISE DEVELOPMENT LP: COMPANY SNAPSHOT
- TABLE 179. HEWLETT PACKARD ENTERPRISE DEVELOPMENT LP: SERVICE SEGMENTS
- TABLE 180. HEWLETT PACKARD ENTERPRISE DEVELOPMENT LP: PRODUCT PORTFOLIO
- TABLE 181. HEWLETT PACKARD ENTERPRISE DEVELOPMENT LP: KEY STRATERGIES
LIST OF FIGURES
- FIGURE 01. WORLD NATURAL LANGUAGE PROCESSING (NLP) MARKET, 2022-2032
- FIGURE 02. SEGMENTATION OF WORLD NATURAL LANGUAGE PROCESSING (NLP) MARKET,2022-2032
- FIGURE 03. TOP INVESTMENT POCKETS IN WORLD NATURAL LANGUAGE PROCESSING (NLP) MARKET (2023-2032)
- FIGURE 04. LOW BARGAINING POWER OF SUPPLIERS
- FIGURE 05. LOW THREAT OF NEW ENTRANTS
- FIGURE 06. LOW THREAT OF SUBSTITUTES
- FIGURE 07. LOW INTENSITY OF RIVALRY
- FIGURE 08. LOW BARGAINING POWER OF BUYERS
- FIGURE 09. GLOBAL WORLD NATURAL LANGUAGE PROCESSING (NLP) MARKET:DRIVERS, RESTRAINTS AND OPPORTUNITIES
- FIGURE 10. WORLD NATURAL LANGUAGE PROCESSING (NLP) MARKET, BY COMPONENT, 2022(%)
- FIGURE 11. COMPARATIVE SHARE ANALYSIS OF WORLD NATURAL LANGUAGE PROCESSING (NLP) MARKET FOR SOLUTION, BY COUNTRY 2022 AND 2032(%)
- FIGURE 12. COMPARATIVE SHARE ANALYSIS OF WORLD NATURAL LANGUAGE PROCESSING (NLP) MARKET FOR SERVICE, BY COUNTRY 2022 AND 2032(%)
- FIGURE 13. WORLD NATURAL LANGUAGE PROCESSING (NLP) MARKET, BY DEPLOYMENT MODE, 2022(%)
- FIGURE 14. COMPARATIVE SHARE ANALYSIS OF WORLD NATURAL LANGUAGE PROCESSING (NLP) MARKET FOR ON-PREMISE, BY COUNTRY 2022 AND 2032(%)
- FIGURE 15. COMPARATIVE SHARE ANALYSIS OF WORLD NATURAL LANGUAGE PROCESSING (NLP) MARKET FOR CLOUD, BY COUNTRY 2022 AND 2032(%)
- FIGURE 16. WORLD NATURAL LANGUAGE PROCESSING (NLP) MARKET, BY ENTERPRISE SIZE, 2022(%)
- FIGURE 17. COMPARATIVE SHARE ANALYSIS OF WORLD NATURAL LANGUAGE PROCESSING (NLP) MARKET FOR LARGE ENTERPRISE, BY COUNTRY 2022 AND 2032(%)
- FIGURE 18. COMPARATIVE SHARE ANALYSIS OF WORLD NATURAL LANGUAGE PROCESSING (NLP) MARKET FOR SMALL AND MEDIUM-SIZED ENTERPRISE, BY COUNTRY 2022 AND 2032(%)
- FIGURE 19. WORLD NATURAL LANGUAGE PROCESSING (NLP) MARKET, BY TYPE, 2022(%)
- FIGURE 20. COMPARATIVE SHARE ANALYSIS OF WORLD NATURAL LANGUAGE PROCESSING (NLP) MARKET FOR STATISTICAL NLP, BY COUNTRY 2022 AND 2032(%)
- FIGURE 21. COMPARATIVE SHARE ANALYSIS OF WORLD NATURAL LANGUAGE PROCESSING (NLP) MARKET FOR RULE-BASED NLP, BY COUNTRY 2022 AND 2032(%)
- FIGURE 22. COMPARATIVE SHARE ANALYSIS OF WORLD NATURAL LANGUAGE PROCESSING (NLP) MARKET FOR HYBRID NLP, BY COUNTRY 2022 AND 2032(%)
- FIGURE 23. WORLD NATURAL LANGUAGE PROCESSING (NLP) MARKET, BY INDUSTRY VERTICAL, 2022(%)
- FIGURE 24. COMPARATIVE SHARE ANALYSIS OF WORLD NATURAL LANGUAGE PROCESSING (NLP) MARKET FOR BFSI, BY COUNTRY 2022 AND 2032(%)
- FIGURE 25. COMPARATIVE SHARE ANALYSIS OF WORLD NATURAL LANGUAGE PROCESSING (NLP) MARKET FOR IT AND TELECOM, BY COUNTRY 2022 AND 2032(%)
- FIGURE 26. COMPARATIVE SHARE ANALYSIS OF WORLD NATURAL LANGUAGE PROCESSING (NLP) MARKET FOR RETAIL AND E-COMMERCE, BY COUNTRY 2022 AND 2032(%)
- FIGURE 27. COMPARATIVE SHARE ANALYSIS OF WORLD NATURAL LANGUAGE PROCESSING (NLP) MARKET FOR HEALTHCARE, BY COUNTRY 2022 AND 2032(%)
- FIGURE 28. COMPARATIVE SHARE ANALYSIS OF WORLD NATURAL LANGUAGE PROCESSING (NLP) MARKET FOR EDUCATION, BY COUNTRY 2022 AND 2032(%)
- FIGURE 29. COMPARATIVE SHARE ANALYSIS OF WORLD NATURAL LANGUAGE PROCESSING (NLP) MARKET FOR MEDIA AND ENTERTAINMENT, BY COUNTRY 2022 AND 2032(%)
- FIGURE 30. COMPARATIVE SHARE ANALYSIS OF WORLD NATURAL LANGUAGE PROCESSING (NLP) MARKET FOR OTHERS, BY COUNTRY 2022 AND 2032(%)
- FIGURE 31. WORLD NATURAL LANGUAGE PROCESSING (NLP) MARKET BY REGION, 2022(%)
- FIGURE 32. U.S. WORLD NATURAL LANGUAGE PROCESSING (NLP) MARKET, 2022-2032 ($MILLION)
- FIGURE 33. CANADA WORLD NATURAL LANGUAGE PROCESSING (NLP) MARKET, 2022-2032 ($MILLION)
- FIGURE 34. UK WORLD NATURAL LANGUAGE PROCESSING (NLP) MARKET, 2022-2032 ($MILLION)
- FIGURE 35. GERMANY WORLD NATURAL LANGUAGE PROCESSING (NLP) MARKET, 2022-2032 ($MILLION)
- FIGURE 36. FRANCE WORLD NATURAL LANGUAGE PROCESSING (NLP) MARKET, 2022-2032 ($MILLION)
- FIGURE 37. ITALY WORLD NATURAL LANGUAGE PROCESSING (NLP) MARKET, 2022-2032 ($MILLION)
- FIGURE 38. SPAIN WORLD NATURAL LANGUAGE PROCESSING (NLP) MARKET, 2022-2032 ($MILLION)
- FIGURE 39. REST OF EUROPE WORLD NATURAL LANGUAGE PROCESSING (NLP) MARKET, 2022-2032 ($MILLION)
- FIGURE 40. CHINA WORLD NATURAL LANGUAGE PROCESSING (NLP) MARKET, 2022-2032 ($MILLION)
- FIGURE 41. JAPAN WORLD NATURAL LANGUAGE PROCESSING (NLP) MARKET, 2022-2032 ($MILLION)
- FIGURE 42. INDIA WORLD NATURAL LANGUAGE PROCESSING (NLP) MARKET, 2022-2032 ($MILLION)
- FIGURE 43. AUSTRALIA WORLD NATURAL LANGUAGE PROCESSING (NLP) MARKET, 2022-2032 ($MILLION)
- FIGURE 44. SOUTH KOREA WORLD NATURAL LANGUAGE PROCESSING (NLP) MARKET, 2022-2032 ($MILLION)
- FIGURE 45. REST OF ASIA-PACIFIC WORLD NATURAL LANGUAGE PROCESSING (NLP) MARKET, 2022-2032 ($MILLION)
- FIGURE 46. LATIN AMERICA WORLD NATURAL LANGUAGE PROCESSING (NLP) MARKET, 2022-2032 ($MILLION)
- FIGURE 47. MIDDLE EAST WORLD NATURAL LANGUAGE PROCESSING (NLP) MARKET, 2022-2032 ($MILLION)
- FIGURE 48. AFRICA WORLD NATURAL LANGUAGE PROCESSING (NLP) MARKET, 2022-2032 ($MILLION)
- FIGURE 49. TOP WINNING STRATEGIES, BY YEAR (2020-2023)
- FIGURE 50. TOP WINNING STRATEGIES, BY DEVELOPMENT (2020-2023)
- FIGURE 51. TOP WINNING STRATEGIES, BY COMPANY (2020-2023)
- FIGURE 52. PRODUCT MAPPING OF TOP 10 PLAYERS
- FIGURE 53. COMPETITIVE DASHBOARD
- FIGURE 54. COMPETITIVE HEATMAP: WORLD NATURAL LANGUAGE PROCESSING (NLP) MARKET
- FIGURE 55. TOP PLAYER POSITIONING, 2022
- FIGURE 56. APPLE INC.: NET REVENUE, 2020-2022 ($MILLION)
- FIGURE 57. APPLE INC.: REVENUE SHARE BY SEGMENT, 2022 (%)
- FIGURE 58. APPLE INC.: REVENUE SHARE BY REGION, 2022 (%)
- FIGURE 59. INTEL CORPORATION: NET REVENUE, 2020-2022 ($MILLION)
- FIGURE 60. INTEL CORPORATION: RESEARCH & DEVELOPMENT EXPENDITURE, 2020-2022 ($MILLION)
- FIGURE 61. INTEL CORPORATION: REVENUE SHARE BY REGION, 2022 (%)
- FIGURE 62. INTEL CORPORATION: REVENUE SHARE BY SEGMENT, 2022 (%)
- FIGURE 63. SAP SE: NET REVENUE, 2020-2022 ($MILLION)
- FIGURE 64. SAP SE: RESEARCH & DEVELOPMENT EXPENDITURE, 2020-2022 ($MILLION)
- FIGURE 65. SAP SE: REVENUE SHARE BY SEGMENT, 2022 (%)
- FIGURE 66. SAP SE: REVENUE SHARE BY REGION, 2022 (%)
- FIGURE 67. GOOGLE LLC: NET REVENUE, 2020-2022 ($MILLION)
- FIGURE 68. GOOGLE LLC: RESEARCH & DEVELOPMENT EXPENDITURE, 2020-2022 ($MILLION)
- FIGURE 69. GOOGLE LLC: REVENUE SHARE BY SEGMENT, 2022 (%)
- FIGURE 70. GOOGLE LLC: REVENUE SHARE BY REGION, 2022 (%)
- FIGURE 71. MICROSOFT CORPORATION: NET REVENUE, 2020-2022 ($MILLION)
- FIGURE 72. MICROSOFT CORPORATION: RESEARCH & DEVELOPMENT EXPENDITURE, 2020-2022 ($MILLION)
- FIGURE 73. MICROSOFT CORPORATION: REVENUE SHARE BY SEGMENT, 2022 (%)
- FIGURE 74. MICROSOFT CORPORATION: REVENUE SHARE BY REGION, 2022 (%)
- FIGURE 75. ORACLE CORPORATION: NET REVENUE, 2020-2022 ($MILLION)
- FIGURE 76. ORACLE CORPORATION: RESEARCH & DEVELOPMENT EXPENDITURE, 2020-2022 ($MILLION)
- FIGURE 77. ORACLE CORPORATION: REVENUE SHARE BY SEGMENT, 2022 (%)
- FIGURE 78. ORACLE CORPORATION: REVENUE SHARE BY REGION, 2022 (%)
- FIGURE 79. INTERNATIONAL BUSINESS MACHINES CORPORATION: SALES REVENUE, 2020-2022 ($MILLION)
- FIGURE 80. INTERNATIONAL BUSINESS MACHINES CORPORATION: REVENUE SHARE BY REGION, 2022 (%)
- FIGURE 81. AMAZON WEB SERVICES, INC.: NET REVENUE, 2020-2022 ($MILLION)
- FIGURE 82. AMAZON WEB SERVICES, INC.: REVENUE SHARE BY SEGMENT, 2022 (%)
- FIGURE 83. AMAZON WEB SERVICES, INC.: REVENUE SHARE BY REGION, 2022 (%)
- FIGURE 84. HEWLETT PACKARD ENTERPRISE DEVELOPMENT LP: NET REVENUE, 2020-2022 ($MILLION)
- FIGURE 85. HEWLETT PACKARD ENTERPRISE DEVELOPMENT LP: REVENUE SHARE BY SEGMENT, 2022 (%)
- FIGURE 86. HEWLETT PACKARD ENTERPRISE DEVELOPMENT LP: REVENUE SHARE BY REGION, 2022 (%)
According to a new report published by Allied Market Research, titled, "Natural Language Processing (NLP) Market," The world natural language processing (NLP) market was valued at $16.2 billion in 2022, and is estimated to reach $239.9 billion by 2032, growing at a CAGR of 31.3% from 2023 to 2032.
Surge in increasing automation as a result of the integration of NLP with deep learning (DL) and machine learning (ML), drive the market growth. In addition, growing demand for smart devices, and increasing demand for advanced text analytics drive the growth of the market. However, complexities due to the usage of code-mixed language while implementing NLP solutions is expected to hamper the growth of the market. Furthermore, increase in automation as a result of the integration of NLP with deep learning and machine learning (ML) and rise in investments in the healthcare sector are expected to create lucrative growth opportunities for the market.
On the basis of deployment mode, on premise segment dominated the natural language processing market in 2022 and is expected to maintain its dominance in the upcoming years owing to provides complete control and visibility over the data, as well as strong authentication security measures propels the market growth significantly. However, the service segment is expected to witness the highest growth, owing to lower deployment costs, predictable running expenses, increased flexibility and scalability in AI-driven NLP, and risk reduction for system downtime.
Region-wise, the natural language processing market size was dominated by North America in 2021 and is expected to retain its position during the forecast period, owing to increase in adoption and growth of advanced and latest technologies, such as cloud computing, AI, and ML, also increasing usage of NLP in BFSI, IT and government sector to improve businesses and customer experience aiding the growth of the natural language processing market. However, Asia Pacific is expected to witness significant growth during the forecast period, owing to adoption of process automation across all industry verticals to enhance customer engagement and increase effectiveness of IT infrastructure to which is expected to fuel the market growth in this region. Furthermore, several major natural language processing solution providers including Apple Inc., Intel Corporation, Google LLC, Microsoft Corporation, Oracle Corporation, International Business Machines Corporation, and Amazon Web Services, Inc., are introducing new products and services to natural language processing.
The report focuses on growth prospects, restraints, and analysis of the natural language processing market trend. The study provides Porter's five forces analysis to understand the impact of numerous factors, such as the bargaining power of suppliers, the competitive intensity of competitors, the threat of new entrants, the threat of substitutes, and the bargaining power of buyers on the natural language processing market share.
Segment review
The global natural language processing market is segmented on the basis of component, deployment mode, enterprise size, type, industry vertical, and region. By component, it is bifurcated into solution and services. By deployment mode, it is segregated into on-premise and cloud. By enterprise size, it is categorized into large enterprise and small and medium-sized enterprise. On the basis of type, it is segregated into statistical NLP, rule-based NLP, and hybrid NLP. By industry vertical, it is segregated into BFSI, IT and telecom, retail and e-commerce, healthcare, education, media and entertainment, and others. Region wise, it is analyzed across North America, Europe, Asia-Pacific, and LAMEA.
The key players operating in the market include Apple Inc., Intel Corporation, SAS Institute Inc., SAP SE, Google LLC, Microsoft Corporation, Oracle Corporation, International Business Machines Corporation, Amazon Web Services, Inc., and Hewlett Packard Enterprise Development LP. Furthermore, it highlights the strategies of the key players to improve the market share and sustain competition.
Key Benefits For Stakeholders
- This report provides a quantitative analysis of the market segments, current trends, estimations, and dynamics of the world natural language processing (nlp) market analysis from 2022 to 2032 to identify the prevailing world natural language processing (NLP) market opportunities.
- The market research is offered along with information related to key drivers, restraints, and opportunities.
- Porter's five forces analysis highlights the potency of buyers and suppliers to enable stakeholders make profit-oriented business decisions and strengthen their supplier-buyer network.
- In-depth analysis of the world natural language processing (NLP) market segmentation assists to determine the prevailing market opportunities.
- Major countries in each region are mapped according to their revenue contribution to the global market.
- Market player positioning facilitates benchmarking and provides a clear understanding of the present position of the market players.
- The report includes the analysis of the regional as well as global world natural language processing (NLP) market trends, key players, market segments, application areas, and market growth strategies.
Additional benefits you will get with this purchase are:
- Quarterly Update and* (only available with a corporate license, on listed price)
- 5 additional Company Profile of client Choice pre- or Post-purchase, as a free update.
- Free Upcoming Version on the Purchase of Five and Enterprise User License.
- 16 analyst hours of support* (post-purchase, if you find additional data requirements upon review of the report, you may receive support amounting to 16 analyst hours to solve questions, and post-sale queries)
- 15% Free Customization* (in case the scope or segment of the report does not match your requirements, 20% is equivalent to 3 working days of free work, applicable once)
- Free data Pack on the Five and Enterprise User License. (Excel version of the report)
- Free Updated report if the report is 6-12 months old or older.
- 24-hour priority response*
- Free Industry updates and white papers.
Possible Customization with this report (with additional cost and timeline talk to the sales executive to know more)
- Senario Analysis & Growth Trend Comparision
- Go To Market Strategy
- New Product Development/ Product Matrix of Key Players
- Regulatory Guidelines
- Additional country or region analysis- market size and forecast
- Expanded list for Company Profiles
- Market share analysis of players at global/region/country level
- SWOT Analysis
Key Market Segments
By Deployment Mode
- On-premise
- Cloud
By Enterprise Size
- Large Enterprise
- Small and Medium-sized Enterprise
By Type
- Statistical NLP
- Rule-based NLP
- Hybrid NLP
By Industry Vertical
- BFSI
- IT and Telecom
- Retail and E-commerce
- Healthcare
- Education
- Media and Entertainment
- Others
By Component
- Solution
- Service
By Region
- North America
- U.S.
- Canada
- Europe
- UK
- Germany
- France
- Italy
- Spain
- Rest of Europe
- Asia-Pacific
- China
- Japan
- India
- Australia
- South Korea
- Rest of Asia-Pacific
- LAMEA
- Latin America
- Middle East
- Africa
Key Market Players:
- Intel Corporation
- Google LLC
- Hewlett Packard Enterprise Development LP
- Microsoft Corporation
- International Business Machines Corporation
- Apple Inc.
- SAP SE
- Oracle Corporation
- SAS Institute Inc.
- Amazon Web Services, Inc.
TABLE OF CONTENTS
CHAPTER 1: INTRODUCTION
- 1.1. Report description
- 1.2. Key market segments
- 1.3. Key benefits to the stakeholders
- 1.4. Research Methodology
- 1.4.1. Primary research
- 1.4.2. Secondary research
- 1.4.3. Analyst tools and models
CHAPTER 2: EXECUTIVE SUMMARY
- 2.1. CXO Perspective
CHAPTER 3: MARKET OVERVIEW
- 3.1. Market definition and scope
- 3.2. Key findings
- 3.2.1. Top impacting factors
- 3.2.2. Top investment pockets
- 3.3. Porter's five forces analysis
- 3.3.1. Low bargaining power of suppliers
- 3.3.2. Low threat of new entrants
- 3.3.3. Low threat of substitutes
- 3.3.4. Low intensity of rivalry
- 3.3.5. Low bargaining power of buyers
- 3.4. Market dynamics
- 3.4.1. Drivers
- 3.4.1.1. Increase in automation as a result of the integration of NLP with deep learning (DL) and machine learning (ML)
- 3.4.1.2. Growth in use of internet and connected devices
- 3.4.1.3. Rise in demand for predictive analytics to reduce risks and identify growth opportunities
- 3.4.1. Drivers
- 3.4.2. Restraints
- 3.4.2.1. Complexities due to the usage of code-mixed language while implementing NLP solutions
- 3.4.2.2. Lack of skilled workforce and reliability issue
- 3.4.3. Opportunities
- 3.4.3.1. Rapid changes in business model technology due to geographical expansion
- 3.4.3.2. Growing adoption of NLP-based applications across industries to boost customer experience
- 3.5. COVID-19 Impact Analysis on the market
CHAPTER 4: WORLD NATURAL LANGUAGE PROCESSING (NLP) MARKET, BY COMPONENT
- 4.1. Overview
- 4.1.1. Market size and forecast
- 4.2. Solution
- 4.2.1. Key market trends, growth factors and opportunities
- 4.2.2. Market size and forecast, by region
- 4.2.3. Market share analysis by country
- 4.3. Service
- 4.3.1. Key market trends, growth factors and opportunities
- 4.3.2. Market size and forecast, by region
- 4.3.3. Market share analysis by country
CHAPTER 5: WORLD NATURAL LANGUAGE PROCESSING (NLP) MARKET, BY DEPLOYMENT MODE
- 5.1. Overview
- 5.1.1. Market size and forecast
- 5.2. On-premise
- 5.2.1. Key market trends, growth factors and opportunities
- 5.2.2. Market size and forecast, by region
- 5.2.3. Market share analysis by country
- 5.3. Cloud
- 5.3.1. Key market trends, growth factors and opportunities
- 5.3.2. Market size and forecast, by region
- 5.3.3. Market share analysis by country
CHAPTER 6: WORLD NATURAL LANGUAGE PROCESSING (NLP) MARKET, BY ENTERPRISE SIZE
- 6.1. Overview
- 6.1.1. Market size and forecast
- 6.2. Large Enterprise
- 6.2.1. Key market trends, growth factors and opportunities
- 6.2.2. Market size and forecast, by region
- 6.2.3. Market share analysis by country
- 6.3. Small and Medium-sized Enterprise
- 6.3.1. Key market trends, growth factors and opportunities
- 6.3.2. Market size and forecast, by region
- 6.3.3. Market share analysis by country
CHAPTER 7: WORLD NATURAL LANGUAGE PROCESSING (NLP) MARKET, BY TYPE
- 7.1. Overview
- 7.1.1. Market size and forecast
- 7.2. Statistical NLP
- 7.2.1. Key market trends, growth factors and opportunities
- 7.2.2. Market size and forecast, by region
- 7.2.3. Market share analysis by country
- 7.3. Rule-based NLP
- 7.3.1. Key market trends, growth factors and opportunities
- 7.3.2. Market size and forecast, by region
- 7.3.3. Market share analysis by country
- 7.4. Hybrid NLP
- 7.4.1. Key market trends, growth factors and opportunities
- 7.4.2. Market size and forecast, by region
- 7.4.3. Market share analysis by country
CHAPTER 8: WORLD NATURAL LANGUAGE PROCESSING (NLP) MARKET, BY INDUSTRY VERTICAL
- 8.1. Overview
- 8.1.1. Market size and forecast
- 8.2. BFSI
- 8.2.1. Key market trends, growth factors and opportunities
- 8.2.2. Market size and forecast, by region
- 8.2.3. Market share analysis by country
- 8.3. IT and Telecom
- 8.3.1. Key market trends, growth factors and opportunities
- 8.3.2. Market size and forecast, by region
- 8.3.3. Market share analysis by country
- 8.4. Retail and E-commerce
- 8.4.1. Key market trends, growth factors and opportunities
- 8.4.2. Market size and forecast, by region
- 8.4.3. Market share analysis by country
- 8.5. Healthcare
- 8.5.1. Key market trends, growth factors and opportunities
- 8.5.2. Market size and forecast, by region
- 8.5.3. Market share analysis by country
- 8.6. Education
- 8.6.1. Key market trends, growth factors and opportunities
- 8.6.2. Market size and forecast, by region
- 8.6.3. Market share analysis by country
- 8.7. Media and Entertainment
- 8.7.1. Key market trends, growth factors and opportunities
- 8.7.2. Market size and forecast, by region
- 8.7.3. Market share analysis by country
- 8.8. Others
- 8.8.1. Key market trends, growth factors and opportunities
- 8.8.2. Market size and forecast, by region
- 8.8.3. Market share analysis by country
CHAPTER 9: WORLD NATURAL LANGUAGE PROCESSING (NLP) MARKET, BY REGION
- 9.1. Overview
- 9.1.1. Market size and forecast By Region
- 9.2. North America
- 9.2.1. Key market trends, growth factors and opportunities
- 9.2.2. Market size and forecast, by Component
- 9.2.3. Market size and forecast, by Deployment Mode
- 9.2.4. Market size and forecast, by Enterprise Size
- 9.2.5. Market size and forecast, by Type
- 9.2.6. Market size and forecast, by Industry Vertical
- 9.2.7. Market size and forecast, by country
- 9.2.7.1. U.S.
- 9.2.7.1.1. Market size and forecast, by Component
- 9.2.7.1.2. Market size and forecast, by Deployment Mode
- 9.2.7.1.3. Market size and forecast, by Enterprise Size
- 9.2.7.1.4. Market size and forecast, by Type
- 9.2.7.1.5. Market size and forecast, by Industry Vertical
- 9.2.7.2. Canada
- 9.2.7.2.1. Market size and forecast, by Component
- 9.2.7.2.2. Market size and forecast, by Deployment Mode
- 9.2.7.2.3. Market size and forecast, by Enterprise Size
- 9.2.7.2.4. Market size and forecast, by Type
- 9.2.7.2.5. Market size and forecast, by Industry Vertical
- 9.3. Europe
- 9.3.1. Key market trends, growth factors and opportunities
- 9.3.2. Market size and forecast, by Component
- 9.3.3. Market size and forecast, by Deployment Mode
- 9.3.4. Market size and forecast, by Enterprise Size
- 9.3.5. Market size and forecast, by Type
- 9.3.6. Market size and forecast, by Industry Vertical
- 9.3.7. Market size and forecast, by country
- 9.3.7.1. UK
- 9.3.7.1.1. Market size and forecast, by Component
- 9.3.7.1.2. Market size and forecast, by Deployment Mode
- 9.3.7.1.3. Market size and forecast, by Enterprise Size
- 9.3.7.1.4. Market size and forecast, by Type
- 9.3.7.1.5. Market size and forecast, by Industry Vertical
- 9.3.7.2. Germany
- 9.3.7.2.1. Market size and forecast, by Component
- 9.3.7.2.2. Market size and forecast, by Deployment Mode
- 9.3.7.2.3. Market size and forecast, by Enterprise Size
- 9.3.7.2.4. Market size and forecast, by Type
- 9.3.7.2.5. Market size and forecast, by Industry Vertical
- 9.3.7.3. France
- 9.3.7.3.1. Market size and forecast, by Component
- 9.3.7.3.2. Market size and forecast, by Deployment Mode
- 9.3.7.3.3. Market size and forecast, by Enterprise Size
- 9.3.7.3.4. Market size and forecast, by Type
- 9.3.7.3.5. Market size and forecast, by Industry Vertical
- 9.3.7.4. Italy
- 9.3.7.4.1. Market size and forecast, by Component
- 9.3.7.4.2. Market size and forecast, by Deployment Mode
- 9.3.7.4.3. Market size and forecast, by Enterprise Size
- 9.3.7.4.4. Market size and forecast, by Type
- 9.3.7.4.5. Market size and forecast, by Industry Vertical
- 9.3.7.5. Spain
- 9.3.7.5.1. Market size and forecast, by Component
- 9.3.7.5.2. Market size and forecast, by Deployment Mode
- 9.3.7.5.3. Market size and forecast, by Enterprise Size
- 9.3.7.5.4. Market size and forecast, by Type
- 9.3.7.5.5. Market size and forecast, by Industry Vertical
- 9.3.7.6. Rest of Europe
- 9.3.7.6.1. Market size and forecast, by Component
- 9.3.7.6.2. Market size and forecast, by Deployment Mode
- 9.3.7.6.3. Market size and forecast, by Enterprise Size
- 9.3.7.6.4. Market size and forecast, by Type
- 9.3.7.6.5. Market size and forecast, by Industry Vertical
- 9.4. Asia-Pacific
- 9.4.1. Key market trends, growth factors and opportunities
- 9.4.2. Market size and forecast, by Component
- 9.4.3. Market size and forecast, by Deployment Mode
- 9.4.4. Market size and forecast, by Enterprise Size
- 9.4.5. Market size and forecast, by Type
- 9.4.6. Market size and forecast, by Industry Vertical
- 9.4.7. Market size and forecast, by country
- 9.4.7.1. China
- 9.4.7.1.1. Market size and forecast, by Component
- 9.4.7.1.2. Market size and forecast, by Deployment Mode
- 9.4.7.1.3. Market size and forecast, by Enterprise Size
- 9.4.7.1.4. Market size and forecast, by Type
- 9.4.7.1.5. Market size and forecast, by Industry Vertical
- 9.4.7.2. Japan
- 9.4.7.2.1. Market size and forecast, by Component
- 9.4.7.2.2. Market size and forecast, by Deployment Mode
- 9.4.7.2.3. Market size and forecast, by Enterprise Size
- 9.4.7.2.4. Market size and forecast, by Type
- 9.4.7.2.5. Market size and forecast, by Industry Vertical
- 9.4.7.3. India
- 9.4.7.3.1. Market size and forecast, by Component
- 9.4.7.3.2. Market size and forecast, by Deployment Mode
- 9.4.7.3.3. Market size and forecast, by Enterprise Size
- 9.4.7.3.4. Market size and forecast, by Type
- 9.4.7.3.5. Market size and forecast, by Industry Vertical
- 9.4.7.4. Australia
- 9.4.7.4.1. Market size and forecast, by Component
- 9.4.7.4.2. Market size and forecast, by Deployment Mode
- 9.4.7.4.3. Market size and forecast, by Enterprise Size
- 9.4.7.4.4. Market size and forecast, by Type
- 9.4.7.4.5. Market size and forecast, by Industry Vertical
- 9.4.7.5. South Korea
- 9.4.7.5.1. Market size and forecast, by Component
- 9.4.7.5.2. Market size and forecast, by Deployment Mode
- 9.4.7.5.3. Market size and forecast, by Enterprise Size
- 9.4.7.5.4. Market size and forecast, by Type
- 9.4.7.5.5. Market size and forecast, by Industry Vertical
- 9.4.7.6. Rest of Asia-Pacific
- 9.4.7.6.1. Market size and forecast, by Component
- 9.4.7.6.2. Market size and forecast, by Deployment Mode
- 9.4.7.6.3. Market size and forecast, by Enterprise Size
- 9.4.7.6.4. Market size and forecast, by Type
- 9.4.7.6.5. Market size and forecast, by Industry Vertical
- 9.5. LAMEA
- 9.5.1. Key market trends, growth factors and opportunities
- 9.5.2. Market size and forecast, by Component
- 9.5.3. Market size and forecast, by Deployment Mode
- 9.5.4. Market size and forecast, by Enterprise Size
- 9.5.5. Market size and forecast, by Type
- 9.5.6. Market size and forecast, by Industry Vertical
- 9.5.7. Market size and forecast, by country
- 9.5.7.1. Latin America
- 9.5.7.1.1. Market size and forecast, by Component
- 9.5.7.1.2. Market size and forecast, by Deployment Mode
- 9.5.7.1.3. Market size and forecast, by Enterprise Size
- 9.5.7.1.4. Market size and forecast, by Type
- 9.5.7.1.5. Market size and forecast, by Industry Vertical
- 9.5.7.2. Middle East
- 9.5.7.2.1. Market size and forecast, by Component
- 9.5.7.2.2. Market size and forecast, by Deployment Mode
- 9.5.7.2.3. Market size and forecast, by Enterprise Size
- 9.5.7.2.4. Market size and forecast, by Type
- 9.5.7.2.5. Market size and forecast, by Industry Vertical
- 9.5.7.3. Africa
- 9.5.7.3.1. Market size and forecast, by Component
- 9.5.7.3.2. Market size and forecast, by Deployment Mode
- 9.5.7.3.3. Market size and forecast, by Enterprise Size
- 9.5.7.3.4. Market size and forecast, by Type
- 9.5.7.3.5. Market size and forecast, by Industry Vertical
CHAPTER 10: COMPETITIVE LANDSCAPE
- 10.1. Introduction
- 10.2. Top winning strategies
- 10.3. Product Mapping of Top 10 Player
- 10.4. Competitive Dashboard
- 10.5. Competitive Heatmap
- 10.6. Top player positioning, 2022
CHAPTER 11: COMPANY PROFILES
- 11.1. Apple Inc.
- 11.1.1. Company overview
- 11.1.2. Key Executives
- 11.1.3. Company snapshot
- 11.1.4. Operating business segments
- 11.1.5. Product portfolio
- 11.1.6. Business performance
- 11.1.7. Key strategic moves and developments
- 11.2. Intel Corporation
- 11.2.1. Company overview
- 11.2.2. Key Executives
- 11.2.3. Company snapshot
- 11.2.4. Operating business segments
- 11.2.5. Product portfolio
- 11.2.6. Business performance
- 11.2.7. Key strategic moves and developments
- 11.3. SAS Institute Inc.
- 11.3.1. Company overview
- 11.3.2. Key Executives
- 11.3.3. Company snapshot
- 11.3.4. Operating business segments
- 11.3.5. Product portfolio
- 11.3.6. Key strategic moves and developments
- 11.4. SAP SE
- 11.4.1. Company overview
- 11.4.2. Key Executives
- 11.4.3. Company snapshot
- 11.4.4. Operating business segments
- 11.4.5. Product portfolio
- 11.4.6. Business performance
- 11.4.7. Key strategic moves and developments
- 11.5. Google LLC
- 11.5.1. Company overview
- 11.5.2. Key Executives
- 11.5.3. Company snapshot
- 11.5.4. Operating business segments
- 11.5.5. Product portfolio
- 11.5.6. Business performance
- 11.5.7. Key strategic moves and developments
- 11.6. Microsoft Corporation
- 11.6.1. Company overview
- 11.6.2. Key Executives
- 11.6.3. Company snapshot
- 11.6.4. Operating business segments
- 11.6.5. Product portfolio
- 11.6.6. Business performance
- 11.6.7. Key strategic moves and developments
- 11.7. Oracle Corporation
- 11.7.1. Company overview
- 11.7.2. Key Executives
- 11.7.3. Company snapshot
- 11.7.4. Operating business segments
- 11.7.5. Product portfolio
- 11.7.6. Business performance
- 11.7.7. Key strategic moves and developments
- 11.8. International Business Machines Corporation
- 11.8.1. Company overview
- 11.8.2. Key Executives
- 11.8.3. Company snapshot
- 11.8.4. Operating business segments
- 11.8.5. Product portfolio
- 11.8.6. Business performance
- 11.8.7. Key strategic moves and developments
- 11.9. Amazon Web Services, Inc.
- 11.9.1. Company overview
- 11.9.2. Key Executives
- 11.9.3. Company snapshot
- 11.9.4. Operating business segments
- 11.9.5. Product portfolio
- 11.9.6. Business performance
- 11.9.7. Key strategic moves and developments
- 11.10. Hewlett Packard Enterprise Development LP
- 11.10.1. Company overview
- 11.10.2. Key Executives
- 11.10.3. Company snapshot
- 11.10.4. Operating business segments
- 11.10.5. Product portfolio
- 11.10.6. Business performance
- 11.10.7. Key strategic moves and developments