 |
市場調査レポート
商品コード
1365738
ディープラーニング市場:コンポーネント別、用途別、業界別:2023年~2032年の世界機会分析と産業予測Deep Learning Market By Component, By Application, By Industry Vertical : Global Opportunity Analysis and Industry Forecast, 2023-2032 |
||||||

| ディープラーニング市場:コンポーネント別、用途別、業界別:2023年~2032年の世界機会分析と産業予測 |
|
出版日: 2023年08月01日
発行: Allied Market Research
ページ情報: 英文 350 Pages
納期: 2~3営業日
|
- 全表示
- 概要
- 図表
- 目次
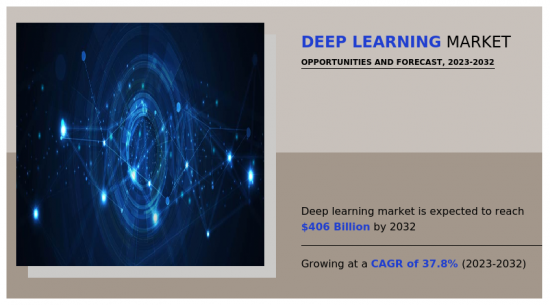
ディープラーニング市場は2022年に169億米ドルと評価され、2023年から2032年までのCAGRは37.8%で成長し、2032年には4,060億米ドルに達すると推定されています。
ディープラーニングは、機械学習(ML)と人工知能(AI)のサブセットであり、人間の学習プロセスを模倣して模範的に学習します。この技術は、大量のデータの収集プロセス、分析プロセス、処理プロセスを容易にし、高速化するため、データ科学者を支援します。さらに、データ間の複雑な相関関係を作り、例や過去の失敗から学習します。さらに、ディープラーニング技術はチャットボットに力を与え、優れた顧客体験と満足を提供します。さらに、ディープラーニングはMLやAIとともに、iPhoneのSiriやGoogleアシスタントのような音声アシスタント業務を可能にします。さらに、この技術はeコマースサイトの迅速なナビゲーションを助ける。したがって、ディープラーニング技術は様々な用途があり、様々な業界で役立っています。
ディープラーニング市場の成長を促進する主な要因には、データの利用可能性の増大とハードウェア技術の進歩が含まれます。デジタル機器やオンラインプラットフォームの普及により、膨大なデータセットが生成されています。このため、これらのデータから意味のある洞察を抽出するためのディープラーニング技術の採用が促進されています。さらに、強力なグラフィック・プロセッシングユニット(GPU)や、テンソルプロセッシングユニット(TPU)などの特殊なハードウェアアクセラレータの開発により、ディープラーニングモデルのトレーニングや推論が高速化されています。しかし、データセキュリティへの懸念の高まりと高い計算要件が、市場成長の妨げになると予想されます。大量の機密データを収集・保存することで、データのプライバシーやセキュリティ侵害に対する懸念が高まっています。さらに、複雑なモデルの学習には高価なハードウェアが必要で、中堅・中小企業には手が届かないです。それとは反対に、業界固有のアプリケーションや自然言語処理は、予測期間中に世界のディープラーニング市場の拡大に有益な機会を提供すると期待されています。ディープラーニング技術は、医療、製造、金融などのさまざまな業界にカスタマイズされたソリューションを提供するのに役立ちます。さらに、ディープラーニングを利用した自然言語処理は、顧客サービス、感情分析、言語翻訳、コンテンツ生成を変革する可能性があります。
目次
第1章 イントロダクション
第2章 エグゼクティブサマリー
第3章 市場概要
- 市場の定義と範囲
- 主な調査結果
- 影響要因
- 主な投資機会
- ポーターのファイブフォース分析
- 市場力学
- 促進要因
- ハードウェアコストの低下
- データの利用可能性の増加とハードウェアの進歩
- ディープラーニングをサポートするための研究開発投資の増加
- 抑制要因
- 技術に使用される複雑なアルゴリズムによるハードウェアの複雑化
- 技術的専門知識の欠如と標準およびプロトコルの不在
- 機会
- 医療と製造業における累積支出
- 促進要因
- COVID-19市場への影響分析
第4章 ディープラーニング市場:コンポーネント別
- 概要
- ハードウェア
- ソフトウェア
- サービス
第5章 ディープラーニング市場:用途別
- 概要
- 画像認識
- 信号認識
- データマイニング
- その他
第6章 ディープラーニング市場:業界別
- 概要
- セキュリティ
- マーケティング
- 自動車産業
- 小売・eコマース
- 医療
- 製造業
- 法律
- その他
第7章 ディープラーニング市場:地域別
- 概要
- 北米
- 米国
- カナダ
- 欧州
- 英国
- ドイツ
- フランス
- イタリア
- スペイン
- その他
- アジア太平洋
- 中国
- 日本
- インド
- オーストラリア
- 韓国
- その他
- ラテンアメリカ
- ラテンアメリカ
- 中東
- アフリカ
第8章 競合情勢
- イントロダクション
- 主要成功戦略
- 主要10社の製品マッピング
- 競合ダッシュボード
- 競合ヒートマップ
- 主要企業のポジショニング、2022年
第9章 企業プロファイル
- Advanced Micro Devices Inc.(Xilinx Inc.)
- Amazon Web Services, Inc.
- Google LLC
- IBM Corporation
- Intel Corporation
- Microsoft Corporation
- NVIDIA Corporation
- Qualcomm Technologies, Inc.
- Samsung
- Xilinx
LIST OF TABLES
- TABLE 01. GLOBAL DEEP LEARNING MARKET, BY COMPONENT, 2022-2032 ($MILLION)
- TABLE 02. DEEP LEARNING MARKET FOR HARDWARE, BY REGION, 2022-2032 ($MILLION)
- TABLE 03. DEEP LEARNING MARKET FOR SOFTWARE, BY REGION, 2022-2032 ($MILLION)
- TABLE 04. DEEP LEARNING MARKET FOR SERVICE, BY REGION, 2022-2032 ($MILLION)
- TABLE 05. GLOBAL DEEP LEARNING MARKET, BY APPLICATION, 2022-2032 ($MILLION)
- TABLE 06. DEEP LEARNING MARKET FOR IMAGE RECOGNITION, BY REGION, 2022-2032 ($MILLION)
- TABLE 07. DEEP LEARNING MARKET FOR SIGNAL RECOGNITION, BY REGION, 2022-2032 ($MILLION)
- TABLE 08. DEEP LEARNING MARKET FOR DATA MINING, BY REGION, 2022-2032 ($MILLION)
- TABLE 09. DEEP LEARNING MARKET FOR OTHERS, BY REGION, 2022-2032 ($MILLION)
- TABLE 10. GLOBAL DEEP LEARNING MARKET, BY INDUSTRY VERTICAL, 2022-2032 ($MILLION)
- TABLE 11. DEEP LEARNING MARKET FOR SECURITY, BY REGION, 2022-2032 ($MILLION)
- TABLE 12. DEEP LEARNING MARKET FOR MARKETING, BY REGION, 2022-2032 ($MILLION)
- TABLE 13. DEEP LEARNING MARKET FOR AUTOMOTIVE, BY REGION, 2022-2032 ($MILLION)
- TABLE 14. DEEP LEARNING MARKET FOR RETAIL AND E-COMMERCE, BY REGION, 2022-2032 ($MILLION)
- TABLE 15. DEEP LEARNING MARKET FOR HEALTHCARE, BY REGION, 2022-2032 ($MILLION)
- TABLE 16. DEEP LEARNING MARKET FOR MANUFACTURING, BY REGION, 2022-2032 ($MILLION)
- TABLE 17. DEEP LEARNING MARKET FOR LAW, BY REGION, 2022-2032 ($MILLION)
- TABLE 18. DEEP LEARNING MARKET FOR OTHERS, BY REGION, 2022-2032 ($MILLION)
- TABLE 19. DEEP LEARNING MARKET, BY REGION, 2022-2032 ($MILLION)
- TABLE 20. NORTH AMERICA DEEP LEARNING MARKET, BY COMPONENT, 2022-2032 ($MILLION)
- TABLE 21. NORTH AMERICA DEEP LEARNING MARKET, BY APPLICATION, 2022-2032 ($MILLION)
- TABLE 22. NORTH AMERICA DEEP LEARNING MARKET, BY INDUSTRY VERTICAL, 2022-2032 ($MILLION)
- TABLE 23. NORTH AMERICA DEEP LEARNING MARKET, BY COUNTRY, 2022-2032 ($MILLION)
- TABLE 24. U.S. DEEP LEARNING MARKET, BY COMPONENT, 2022-2032 ($MILLION)
- TABLE 25. U.S. DEEP LEARNING MARKET, BY APPLICATION, 2022-2032 ($MILLION)
- TABLE 26. U.S. DEEP LEARNING MARKET, BY INDUSTRY VERTICAL, 2022-2032 ($MILLION)
- TABLE 27. CANADA DEEP LEARNING MARKET, BY COMPONENT, 2022-2032 ($MILLION)
- TABLE 28. CANADA DEEP LEARNING MARKET, BY APPLICATION, 2022-2032 ($MILLION)
- TABLE 29. CANADA DEEP LEARNING MARKET, BY INDUSTRY VERTICAL, 2022-2032 ($MILLION)
- TABLE 30. EUROPE DEEP LEARNING MARKET, BY COMPONENT, 2022-2032 ($MILLION)
- TABLE 31. EUROPE DEEP LEARNING MARKET, BY APPLICATION, 2022-2032 ($MILLION)
- TABLE 32. EUROPE DEEP LEARNING MARKET, BY INDUSTRY VERTICAL, 2022-2032 ($MILLION)
- TABLE 33. EUROPE DEEP LEARNING MARKET, BY COUNTRY, 2022-2032 ($MILLION)
- TABLE 34. UK DEEP LEARNING MARKET, BY COMPONENT, 2022-2032 ($MILLION)
- TABLE 35. UK DEEP LEARNING MARKET, BY APPLICATION, 2022-2032 ($MILLION)
- TABLE 36. UK DEEP LEARNING MARKET, BY INDUSTRY VERTICAL, 2022-2032 ($MILLION)
- TABLE 37. GERMANY DEEP LEARNING MARKET, BY COMPONENT, 2022-2032 ($MILLION)
- TABLE 38. GERMANY DEEP LEARNING MARKET, BY APPLICATION, 2022-2032 ($MILLION)
- TABLE 39. GERMANY DEEP LEARNING MARKET, BY INDUSTRY VERTICAL, 2022-2032 ($MILLION)
- TABLE 40. FRANCE DEEP LEARNING MARKET, BY COMPONENT, 2022-2032 ($MILLION)
- TABLE 41. FRANCE DEEP LEARNING MARKET, BY APPLICATION, 2022-2032 ($MILLION)
- TABLE 42. FRANCE DEEP LEARNING MARKET, BY INDUSTRY VERTICAL, 2022-2032 ($MILLION)
- TABLE 43. ITALY DEEP LEARNING MARKET, BY COMPONENT, 2022-2032 ($MILLION)
- TABLE 44. ITALY DEEP LEARNING MARKET, BY APPLICATION, 2022-2032 ($MILLION)
- TABLE 45. ITALY DEEP LEARNING MARKET, BY INDUSTRY VERTICAL, 2022-2032 ($MILLION)
- TABLE 46. SPAIN DEEP LEARNING MARKET, BY COMPONENT, 2022-2032 ($MILLION)
- TABLE 47. SPAIN DEEP LEARNING MARKET, BY APPLICATION, 2022-2032 ($MILLION)
- TABLE 48. SPAIN DEEP LEARNING MARKET, BY INDUSTRY VERTICAL, 2022-2032 ($MILLION)
- TABLE 49. REST OF EUROPE DEEP LEARNING MARKET, BY COMPONENT, 2022-2032 ($MILLION)
- TABLE 50. REST OF EUROPE DEEP LEARNING MARKET, BY APPLICATION, 2022-2032 ($MILLION)
- TABLE 51. REST OF EUROPE DEEP LEARNING MARKET, BY INDUSTRY VERTICAL, 2022-2032 ($MILLION)
- TABLE 52. ASIA-PACIFIC DEEP LEARNING MARKET, BY COMPONENT, 2022-2032 ($MILLION)
- TABLE 53. ASIA-PACIFIC DEEP LEARNING MARKET, BY APPLICATION, 2022-2032 ($MILLION)
- TABLE 54. ASIA-PACIFIC DEEP LEARNING MARKET, BY INDUSTRY VERTICAL, 2022-2032 ($MILLION)
- TABLE 55. ASIA-PACIFIC DEEP LEARNING MARKET, BY COUNTRY, 2022-2032 ($MILLION)
- TABLE 56. CHINA DEEP LEARNING MARKET, BY COMPONENT, 2022-2032 ($MILLION)
- TABLE 57. CHINA DEEP LEARNING MARKET, BY APPLICATION, 2022-2032 ($MILLION)
- TABLE 58. CHINA DEEP LEARNING MARKET, BY INDUSTRY VERTICAL, 2022-2032 ($MILLION)
- TABLE 59. JAPAN DEEP LEARNING MARKET, BY COMPONENT, 2022-2032 ($MILLION)
- TABLE 60. JAPAN DEEP LEARNING MARKET, BY APPLICATION, 2022-2032 ($MILLION)
- TABLE 61. JAPAN DEEP LEARNING MARKET, BY INDUSTRY VERTICAL, 2022-2032 ($MILLION)
- TABLE 62. INDIA DEEP LEARNING MARKET, BY COMPONENT, 2022-2032 ($MILLION)
- TABLE 63. INDIA DEEP LEARNING MARKET, BY APPLICATION, 2022-2032 ($MILLION)
- TABLE 64. INDIA DEEP LEARNING MARKET, BY INDUSTRY VERTICAL, 2022-2032 ($MILLION)
- TABLE 65. AUSTRALIA DEEP LEARNING MARKET, BY COMPONENT, 2022-2032 ($MILLION)
- TABLE 66. AUSTRALIA DEEP LEARNING MARKET, BY APPLICATION, 2022-2032 ($MILLION)
- TABLE 67. AUSTRALIA DEEP LEARNING MARKET, BY INDUSTRY VERTICAL, 2022-2032 ($MILLION)
- TABLE 68. SOUTH KOREA DEEP LEARNING MARKET, BY COMPONENT, 2022-2032 ($MILLION)
- TABLE 69. SOUTH KOREA DEEP LEARNING MARKET, BY APPLICATION, 2022-2032 ($MILLION)
- TABLE 70. SOUTH KOREA DEEP LEARNING MARKET, BY INDUSTRY VERTICAL, 2022-2032 ($MILLION)
- TABLE 71. REST OF ASIA-PACIFIC DEEP LEARNING MARKET, BY COMPONENT, 2022-2032 ($MILLION)
- TABLE 72. REST OF ASIA-PACIFIC DEEP LEARNING MARKET, BY APPLICATION, 2022-2032 ($MILLION)
- TABLE 73. REST OF ASIA-PACIFIC DEEP LEARNING MARKET, BY INDUSTRY VERTICAL, 2022-2032 ($MILLION)
- TABLE 74. LAMEA DEEP LEARNING MARKET, BY COMPONENT, 2022-2032 ($MILLION)
- TABLE 75. LAMEA DEEP LEARNING MARKET, BY APPLICATION, 2022-2032 ($MILLION)
- TABLE 76. LAMEA DEEP LEARNING MARKET, BY INDUSTRY VERTICAL, 2022-2032 ($MILLION)
- TABLE 77. LAMEA DEEP LEARNING MARKET, BY COUNTRY, 2022-2032 ($MILLION)
- TABLE 78. LATIN AMERICA DEEP LEARNING MARKET, BY COMPONENT, 2022-2032 ($MILLION)
- TABLE 79. LATIN AMERICA DEEP LEARNING MARKET, BY APPLICATION, 2022-2032 ($MILLION)
- TABLE 80. LATIN AMERICA DEEP LEARNING MARKET, BY INDUSTRY VERTICAL, 2022-2032 ($MILLION)
- TABLE 81. MIDDLE EAST DEEP LEARNING MARKET, BY COMPONENT, 2022-2032 ($MILLION)
- TABLE 82. MIDDLE EAST DEEP LEARNING MARKET, BY APPLICATION, 2022-2032 ($MILLION)
- TABLE 83. MIDDLE EAST DEEP LEARNING MARKET, BY INDUSTRY VERTICAL, 2022-2032 ($MILLION)
- TABLE 84. AFRICA DEEP LEARNING MARKET, BY COMPONENT, 2022-2032 ($MILLION)
- TABLE 85. AFRICA DEEP LEARNING MARKET, BY APPLICATION, 2022-2032 ($MILLION)
- TABLE 86. AFRICA DEEP LEARNING MARKET, BY INDUSTRY VERTICAL, 2022-2032 ($MILLION)
- TABLE 87. ADVANCED MICRO DEVICES INC.(XILINX INC.): KEY EXECUTIVES
- TABLE 88. ADVANCED MICRO DEVICES INC.(XILINX INC.): COMPANY SNAPSHOT
- TABLE 89. ADVANCED MICRO DEVICES INC.(XILINX INC.): PRODUCT SEGMENTS
- TABLE 90. ADVANCED MICRO DEVICES INC.(XILINX INC.): PRODUCT PORTFOLIO
- TABLE 91. ADVANCED MICRO DEVICES INC.(XILINX INC.): KEY STRATERGIES
- TABLE 92. AMAZON WEB SERVICES, INC.: KEY EXECUTIVES
- TABLE 93. AMAZON WEB SERVICES, INC.: COMPANY SNAPSHOT
- TABLE 94. AMAZON WEB SERVICES, INC.: SERVICE SEGMENTS
- TABLE 95. AMAZON WEB SERVICES, INC.: PRODUCT PORTFOLIO
- TABLE 96. AMAZON WEB SERVICES, INC.: KEY STRATERGIES
- TABLE 97. GOOGLE LLC: KEY EXECUTIVES
- TABLE 98. GOOGLE LLC: COMPANY SNAPSHOT
- TABLE 99. GOOGLE LLC: SERVICE SEGMENTS
- TABLE 100. GOOGLE LLC: PRODUCT PORTFOLIO
- TABLE 101. GOOGLE LLC: KEY STRATERGIES
- TABLE 102. IBM CORPORATION: KEY EXECUTIVES
- TABLE 103. IBM CORPORATION: COMPANY SNAPSHOT
- TABLE 104. IBM CORPORATION: SERVICE SEGMENTS
- TABLE 105. IBM CORPORATION: PRODUCT PORTFOLIO
- TABLE 106. IBM CORPORATION: KEY STRATERGIES
- TABLE 107. INTEL CORPORATION: KEY EXECUTIVES
- TABLE 108. INTEL CORPORATION: COMPANY SNAPSHOT
- TABLE 109. INTEL CORPORATION: PRODUCT SEGMENTS
- TABLE 110. INTEL CORPORATION: PRODUCT PORTFOLIO
- TABLE 111. INTEL CORPORATION: KEY STRATERGIES
- TABLE 112. MICROSOFT CORPORATION: KEY EXECUTIVES
- TABLE 113. MICROSOFT CORPORATION: COMPANY SNAPSHOT
- TABLE 114. MICROSOFT CORPORATION: SERVICE SEGMENTS
- TABLE 115. MICROSOFT CORPORATION: PRODUCT PORTFOLIO
- TABLE 116. MICROSOFT CORPORATION: KEY STRATERGIES
- TABLE 117. NVIDIA CORPORATION: KEY EXECUTIVES
- TABLE 118. NVIDIA CORPORATION: COMPANY SNAPSHOT
- TABLE 119. NVIDIA CORPORATION: PRODUCT SEGMENTS
- TABLE 120. NVIDIA CORPORATION: PRODUCT PORTFOLIO
- TABLE 121. NVIDIA CORPORATION: KEY STRATERGIES
- TABLE 122. QUALCOMM TECHNOLOGIES, INC. : KEY EXECUTIVES
- TABLE 123. QUALCOMM TECHNOLOGIES, INC. : COMPANY SNAPSHOT
- TABLE 124. QUALCOMM TECHNOLOGIES, INC. : SERVICE SEGMENTS
- TABLE 125. QUALCOMM TECHNOLOGIES, INC. : PRODUCT PORTFOLIO
- TABLE 126. QUALCOMM TECHNOLOGIES, INC. : KEY STRATERGIES
- TABLE 127. SAMSUNG: KEY EXECUTIVES
- TABLE 128. SAMSUNG: COMPANY SNAPSHOT
- TABLE 129. SAMSUNG: SERVICE SEGMENTS
- TABLE 130. SAMSUNG: PRODUCT PORTFOLIO
- TABLE 131. SAMSUNG: KEY STRATERGIES
- TABLE 132. XILINX: KEY EXECUTIVES
- TABLE 133. XILINX: COMPANY SNAPSHOT
- TABLE 134. XILINX: SERVICE SEGMENTS
- TABLE 135. XILINX: PRODUCT PORTFOLIO
- TABLE 136. XILINX: KEY STRATERGIES
LIST OF FIGURES
- FIGURE 01. DEEP LEARNING MARKET, 2022-2032
- FIGURE 02. SEGMENTATION OF DEEP LEARNING MARKET,2022-2032
- FIGURE 03. TOP INVESTMENT POCKETS IN DEEP LEARNING MARKET (2023-2032)
- FIGURE 04. MODERATE-TO-HIGH BARGAINING POWER OF SUPPLIERS
- FIGURE 05. MODERATE-TO-HIGH THREAT OF NEW ENTRANTS
- FIGURE 06. LOW -TO-MODERATE THREAT OF SUBSTITUTES
- FIGURE 07. MODERATE-TO-HIGH INTENSITY OF RIVALRY
- FIGURE 08. MODERATE-TO-HIGH BARGAINING POWER OF BUYERS
- FIGURE 09. GLOBAL DEEP LEARNING MARKET:DRIVERS, RESTRAINTS AND OPPORTUNITIES
- FIGURE 10. DEEP LEARNING MARKET, BY COMPONENT, 2022(%)
- FIGURE 11. COMPARATIVE SHARE ANALYSIS OF DEEP LEARNING MARKET FOR HARDWARE, BY COUNTRY 2022 AND 2032(%)
- FIGURE 12. COMPARATIVE SHARE ANALYSIS OF DEEP LEARNING MARKET FOR SOFTWARE, BY COUNTRY 2022 AND 2032(%)
- FIGURE 13. COMPARATIVE SHARE ANALYSIS OF DEEP LEARNING MARKET FOR SERVICE, BY COUNTRY 2022 AND 2032(%)
- FIGURE 14. DEEP LEARNING MARKET, BY APPLICATION, 2022(%)
- FIGURE 15. COMPARATIVE SHARE ANALYSIS OF DEEP LEARNING MARKET FOR IMAGE RECOGNITION, BY COUNTRY 2022 AND 2032(%)
- FIGURE 16. COMPARATIVE SHARE ANALYSIS OF DEEP LEARNING MARKET FOR SIGNAL RECOGNITION, BY COUNTRY 2022 AND 2032(%)
- FIGURE 17. COMPARATIVE SHARE ANALYSIS OF DEEP LEARNING MARKET FOR DATA MINING, BY COUNTRY 2022 AND 2032(%)
- FIGURE 18. COMPARATIVE SHARE ANALYSIS OF DEEP LEARNING MARKET FOR OTHERS, BY COUNTRY 2022 AND 2032(%)
- FIGURE 19. DEEP LEARNING MARKET, BY INDUSTRY VERTICAL, 2022(%)
- FIGURE 20. COMPARATIVE SHARE ANALYSIS OF DEEP LEARNING MARKET FOR SECURITY, BY COUNTRY 2022 AND 2032(%)
- FIGURE 21. COMPARATIVE SHARE ANALYSIS OF DEEP LEARNING MARKET FOR MARKETING, BY COUNTRY 2022 AND 2032(%)
- FIGURE 22. COMPARATIVE SHARE ANALYSIS OF DEEP LEARNING MARKET FOR AUTOMOTIVE, BY COUNTRY 2022 AND 2032(%)
- FIGURE 23. COMPARATIVE SHARE ANALYSIS OF DEEP LEARNING MARKET FOR RETAIL AND E-COMMERCE, BY COUNTRY 2022 AND 2032(%)
- FIGURE 24. COMPARATIVE SHARE ANALYSIS OF DEEP LEARNING MARKET FOR HEALTHCARE, BY COUNTRY 2022 AND 2032(%)
- FIGURE 25. COMPARATIVE SHARE ANALYSIS OF DEEP LEARNING MARKET FOR MANUFACTURING, BY COUNTRY 2022 AND 2032(%)
- FIGURE 26. COMPARATIVE SHARE ANALYSIS OF DEEP LEARNING MARKET FOR LAW, BY COUNTRY 2022 AND 2032(%)
- FIGURE 27. COMPARATIVE SHARE ANALYSIS OF DEEP LEARNING MARKET FOR OTHERS, BY COUNTRY 2022 AND 2032(%)
- FIGURE 28. DEEP LEARNING MARKET BY REGION, 2022(%)
- FIGURE 29. U.S. DEEP LEARNING MARKET, 2022-2032 ($MILLION)
- FIGURE 30. CANADA DEEP LEARNING MARKET, 2022-2032 ($MILLION)
- FIGURE 31. UK DEEP LEARNING MARKET, 2022-2032 ($MILLION)
- FIGURE 32. GERMANY DEEP LEARNING MARKET, 2022-2032 ($MILLION)
- FIGURE 33. FRANCE DEEP LEARNING MARKET, 2022-2032 ($MILLION)
- FIGURE 34. ITALY DEEP LEARNING MARKET, 2022-2032 ($MILLION)
- FIGURE 35. SPAIN DEEP LEARNING MARKET, 2022-2032 ($MILLION)
- FIGURE 36. REST OF EUROPE DEEP LEARNING MARKET, 2022-2032 ($MILLION)
- FIGURE 37. CHINA DEEP LEARNING MARKET, 2022-2032 ($MILLION)
- FIGURE 38. JAPAN DEEP LEARNING MARKET, 2022-2032 ($MILLION)
- FIGURE 39. INDIA DEEP LEARNING MARKET, 2022-2032 ($MILLION)
- FIGURE 40. AUSTRALIA DEEP LEARNING MARKET, 2022-2032 ($MILLION)
- FIGURE 41. SOUTH KOREA DEEP LEARNING MARKET, 2022-2032 ($MILLION)
- FIGURE 42. REST OF ASIA-PACIFIC DEEP LEARNING MARKET, 2022-2032 ($MILLION)
- FIGURE 43. LATIN AMERICA DEEP LEARNING MARKET, 2022-2032 ($MILLION)
- FIGURE 44. MIDDLE EAST DEEP LEARNING MARKET, 2022-2032 ($MILLION)
- FIGURE 45. AFRICA DEEP LEARNING MARKET, 2022-2032 ($MILLION)
- FIGURE 46. TOP WINNING STRATEGIES, BY YEAR (2020-2023)
- FIGURE 47. TOP WINNING STRATEGIES, BY DEVELOPMENT (2020-2023)
- FIGURE 48. TOP WINNING STRATEGIES, BY COMPANY (2020-2023)
- FIGURE 49. PRODUCT MAPPING OF TOP 10 PLAYERS
- FIGURE 50. COMPETITIVE DASHBOARD
- FIGURE 51. COMPETITIVE HEATMAP: DEEP LEARNING MARKET
- FIGURE 52. TOP PLAYER POSITIONING, 2022
- FIGURE 53. ADVANCED MICRO DEVICES INC.(XILINX INC.): NET REVENUE, 2020-2022 ($MILLION)
- FIGURE 54. ADVANCED MICRO DEVICES INC.(XILINX INC.): RESEARCH & DEVELOPMENT EXPENDITURE, 2020-2022
- FIGURE 55. ADVANCED MICRO DEVICES INC.(XILINX INC.): REVENUE SHARE BY SEGMENT, 2022 (%)
- FIGURE 56. ADVANCED MICRO DEVICES INC.(XILINX INC.): REVENUE SHARE BY REGION, 2022 (%)
- FIGURE 57. AMAZON WEB SERVICES, INC.: NET REVENUE, 2020-2022 ($MILLION)
- FIGURE 58. AMAZON WEB SERVICES, INC.: REVENUE SHARE BY SEGMENT, 2022 (%)
- FIGURE 59. AMAZON WEB SERVICES, INC.: REVENUE SHARE BY REGION, 2022 (%)
- FIGURE 60. GOOGLE LLC: NET REVENUE, 2020-2022 ($MILLION)
- FIGURE 61. GOOGLE LLC: RESEARCH & DEVELOPMENT EXPENDITURE, 2020-2022 ($MILLION)
- FIGURE 62. GOOGLE LLC: REVENUE SHARE BY SEGMENT, 2022 (%)
- FIGURE 63. GOOGLE LLC: REVENUE SHARE BY REGION, 2022 (%)
- FIGURE 64. IBM CORPORATION: NET REVENUE, 2020-2022 ($MILLION)
- FIGURE 65. IBM CORPORATION: RESEARCH & DEVELOPMENT EXPENDITURE, 2020-2022 ($MILLION)
- FIGURE 66. IBM CORPORATION: REVENUE SHARE BY SEGMENT, 2022 (%)
- FIGURE 67. IBM CORPORATION: REVENUE SHARE BY REGION, 2022 (%)
- FIGURE 68. INTEL CORPORATION: NET REVENUE, 2020-2022 ($MILLION)
- FIGURE 69. INTEL CORPORATION: RESEARCH & DEVELOPMENT EXPENDITURE, 2020-2022 ($MILLION)
- FIGURE 70. INTEL CORPORATION: REVENUE SHARE BY REGION, 2022 (%)
- FIGURE 71. INTEL CORPORATION: REVENUE SHARE BY SEGMENT, 2022 (%)
- FIGURE 72. MICROSOFT CORPORATION: NET REVENUE, 2020-2022 ($MILLION)
- FIGURE 73. MICROSOFT CORPORATION: RESEARCH & DEVELOPMENT EXPENDITURE, 2020-2022 ($MILLION)
- FIGURE 74. MICROSOFT CORPORATION: REVENUE SHARE BY SEGMENT, 2022 (%)
- FIGURE 75. MICROSOFT CORPORATION: REVENUE SHARE BY REGION, 2022 (%)
- FIGURE 76. NVIDIA CORPORATION: NET REVENUE, 2021-2023 ($MILLION)
- FIGURE 77. NVIDIA CORPORATION: RESEARCH & DEVELOPMENT EXPENDITURE, 2021-2023 ($MILLION)
- FIGURE 78. NVIDIA CORPORATION: REVENUE SHARE BY SEGMENT, 2023 (%)
- FIGURE 79. NVIDIA CORPORATION: REVENUE SHARE BY REGION, 2023 (%)
- FIGURE 80. QUALCOMM TECHNOLOGIES, INC. : NET REVENUE, 2020-2022 ($MILLION)
- FIGURE 81. QUALCOMM TECHNOLOGIES, INC. : RESEARCH & DEVELOPMENT EXPENDITURE, 2020-2022 ($MILLION)
- FIGURE 82. QUALCOMM TECHNOLOGIES, INC. : REVENUE SHARE BY SEGMENT, 2022 (%)
- FIGURE 83. QUALCOMM TECHNOLOGIES, INC. : REVENUE SHARE BY REGION, 2022 (%)
- FIGURE 84. SAMSUNG: NET REVENUE, 2020-2022 ($MILLION)
- FIGURE 85. SAMSUNG: RESEARCH & DEVELOPMENT EXPENDITURE, 2020-2022 ($MILLION)
- FIGURE 86. SAMSUNG: REVENUE SHARE BY SEGMENT, 2022 (%)
- FIGURE 87. SAMSUNG: REVENUE SHARE BY REGION, 2022 (%)
- FIGURE 88. XILINX: NET REVENUE, 2020-2022 ($MILLION)
- FIGURE 89. XILINX: RESEARCH & DEVELOPMENT EXPENDITURE, 2020-2022 ($MILLION)
- FIGURE 90. XILINX: REVENUE SHARE BY SEGMENT, 2022 (%)
- FIGURE 91. XILINX: REVENUE SHARE BY SEGMENT, 2021 (%)
According to a new report published by Allied Market Research, titled, "Deep Learning Market," The deep learning market was valued at $16.9 billion in 2022, and is estimated to reach $406 billion by 2032, growing at a CAGR of 37.8% from 2023 to 2032.
Deep learning is a subset of machine learning (ML) and artificial intelligence (AI) to imitate the human learning process to learn by example. The technology helps data scientists as it aids in facilitating and accelerating the collection process, analyzing process, and processing process for large amounts of data. In addition, it makes complex correlations between data and learning from examples and previous mistakes. Furthermore, deep learning technology powers chatbots to deliver excellent customer experience and satisfaction. Moreover, deep learning along with ML and AI enables voice assistant work such as iPhone Siri and Google Assistant. In addition, the technology helps e-commerce sites to navigate rapidly. Hence, deep learning technology has various uses and is assisting in various industries.
The key factors that drive the growth of the deep learning market include growing data availability and advancements in hardware technology. The proliferation of digital devices and online platforms is generating massive datasets. This is encouraging the adoption of deep learning techniques to extract meaningful insights from these data. Furthermore, the development of powerful graphics processing units (GPUs) and specialized hardware accelerators such as tensor processing units (TPUs) is enabling faster training and inference of deep learning models. However, increasing data security concerns and high computational requirements is expected to hamper the market growth. Collecting and storing large amounts of sensitive data is raising concerns about data privacy and security breaches. Moreover, training high complex models require expensive hardware which is out of range for medium and small-size companies. On the contrary, industry-specific applications and natural language processing is expected to offer remunerative opportunities for the expansion of the global deep learning market during the forecast period. Deep learning technology helps in providing customized solutions to different industries such as healthcare, manufacturing, finance, and others. Furthermore, natural language processing powered by deep learning could transform customer service, sentiment analysis, language translation, and content generation.
The deep learning market is segmented on the basis of component, application, industry vertical, technology, and region. In terms of components, the market is bifurcated into hardware, software, and service. By application, the market is divided into image recognition, signal recognition, data mining, and others. Based on industry vertical, it is divided into security, marketing, automotive, retail & e-commerce, healthcare, manufacturing, law, and others. On the basis of region, it is analyzed across North America, Europe, Asia-Pacific, and LAMEA.
The report analyzes the profiles of key players operating in the deep learning market such as Advanced Micro Devices Inc., Amazon Web Services, Inc., Google LLC, IBM Corporation, Intel Corporation, Microsoft Corporation, NVIDIA Corporation, Qualcomm Technologies, Inc., Samsung and Xilinx. These players have adopted various strategies to increase their market penetration and strengthen their position in the deep learning market.
Key Benefits for Stakeholders
- The study provides in-depth analysis of the global deep learning market along with the current & future trends to illustrate the imminent investment pockets.
- Information about key drivers, restraints, & opportunities and their impact analysis on the global deep learning market size is provided in the report.
- Porter's five forces analysis illustrates the potency of buyers and suppliers operating in the industry.
- The quantitative analysis of the global deep learning market from 2022 to 2032 is provided to determine the market potential.
Additional benefits you will get with this purchase are:
- Quarterly Update and* (only available with a corporate license, on listed price)
- 5 additional Company Profile of client Choice pre- or Post-purchase, as a free update.
- Free Upcoming Version on the Purchase of Five and Enterprise User License.
- 16 analyst hours of support* (post-purchase, if you find additional data requirements upon review of the report, you may receive support amounting to 16 analyst hours to solve questions, and post-sale queries)
- 15% Free Customization* (in case the scope or segment of the report does not match your requirements, 20% is equivalent to 3 working days of free work, applicable once)
- Free data Pack on the Five and Enterprise User License. (Excel version of the report)
- Free Updated report if the report is 6-12 months old or older.
- 24-hour priority response*
- Free Industry updates and white papers.
Possible Customization with this report (with additional cost and timeline talk to the sales executive to know more)
- Investment Opportunities
- Market share analysis of players by products/segments
- Regulatory Guidelines
- Additional company profiles with specific to client's interest
- Additional country or region analysis- market size and forecast
- Key player details (including location, contact details, supplier/vendor network etc. in excel format)
- SWOT Analysis
Key Market Segments
By Component
- Software
- Service
- Hardware
By Application
- Image recognition
- Signal recognition
- Data mining
- Others
By Industry Vertical
- Security
- Marketing
- Automotive
- Retail and E-Commerce
- Healthcare
- Manufacturing
- Law
- Others
By Region
- North America
- U.S.
- Canada
- Europe
- UK
- Germany
- France
- Italy
- Spain
- Rest of Europe
- Asia-Pacific
- China
- Japan
- India
- Australia
- South Korea
- Rest of Asia-Pacific
- LAMEA
- Latin America
- Middle East
- Africa
Key Market Players:
- Amazon Web Services, Inc.
- Google LLC
- IBM Corporation
- Microsoft Corporation
- NVIDIA Corporation
- Xilinx
- Samsung
- Advanced Micro Devices Inc.(Xilinx Inc.)
- Intel Corporation
- Qualcomm Technologies, Inc.
TABLE OF CONTENTS
CHAPTER 1: INTRODUCTION
- 1.1. Report description
- 1.2. Key market segments
- 1.3. Key benefits to the stakeholders
- 1.4. Research Methodology
- 1.4.1. Primary research
- 1.4.2. Secondary research
- 1.4.3. Analyst tools and models
CHAPTER 2: EXECUTIVE SUMMARY
- 2.1. CXO Perspective
CHAPTER 3: MARKET OVERVIEW
- 3.1. Market definition and scope
- 3.2. Key findings
- 3.2.1. Top impacting factors
- 3.2.2. Top investment pockets
- 3.3. Porter's five forces analysis
- 3.3.1. Moderate-to-high bargaining power of suppliers
- 3.3.2. Moderate-to-high threat of new entrants
- 3.3.3. Low -to-moderate threat of substitutes
- 3.3.4. Moderate-to-high intensity of rivalry
- 3.3.5. Moderate-to-high bargaining power of buyers
- 3.4. Market dynamics
- 3.4.1. Drivers
- 3.4.1.1. Decline in hardware cost
- 3.4.1.2. Increase in data availability and advancements in the hardware
- 3.4.1.3. Increasing investment in research and development to support deep learning
- 3.4.1. Drivers
- 3.4.2. Restraints
- 3.4.2.1. Increase in complexity in hardware due to complex algorithm used in technology
- 3.4.2.2. Lack of technical expertise & absence of standards and protocols
- 3.4.3. Opportunities
- 3.4.3.1. Cumulative spending in healthcare and manufacturing industry
- 3.5. COVID-19 Impact Analysis on the market
CHAPTER 4: DEEP LEARNING MARKET, BY COMPONENT
- 4.1. Overview
- 4.1.1. Market size and forecast
- 4.2. Hardware
- 4.2.1. Key market trends, growth factors and opportunities
- 4.2.2. Market size and forecast, by region
- 4.2.3. Market share analysis by country
- 4.3. Software
- 4.3.1. Key market trends, growth factors and opportunities
- 4.3.2. Market size and forecast, by region
- 4.3.3. Market share analysis by country
- 4.4. Service
- 4.4.1. Key market trends, growth factors and opportunities
- 4.4.2. Market size and forecast, by region
- 4.4.3. Market share analysis by country
CHAPTER 5: DEEP LEARNING MARKET, BY APPLICATION
- 5.1. Overview
- 5.1.1. Market size and forecast
- 5.2. Image recognition
- 5.2.1. Key market trends, growth factors and opportunities
- 5.2.2. Market size and forecast, by region
- 5.2.3. Market share analysis by country
- 5.3. Signal recognition
- 5.3.1. Key market trends, growth factors and opportunities
- 5.3.2. Market size and forecast, by region
- 5.3.3. Market share analysis by country
- 5.4. Data mining
- 5.4.1. Key market trends, growth factors and opportunities
- 5.4.2. Market size and forecast, by region
- 5.4.3. Market share analysis by country
- 5.5. Others
- 5.5.1. Key market trends, growth factors and opportunities
- 5.5.2. Market size and forecast, by region
- 5.5.3. Market share analysis by country
CHAPTER 6: DEEP LEARNING MARKET, BY INDUSTRY VERTICAL
- 6.1. Overview
- 6.1.1. Market size and forecast
- 6.2. Security
- 6.2.1. Key market trends, growth factors and opportunities
- 6.2.2. Market size and forecast, by region
- 6.2.3. Market share analysis by country
- 6.3. Marketing
- 6.3.1. Key market trends, growth factors and opportunities
- 6.3.2. Market size and forecast, by region
- 6.3.3. Market share analysis by country
- 6.4. Automotive
- 6.4.1. Key market trends, growth factors and opportunities
- 6.4.2. Market size and forecast, by region
- 6.4.3. Market share analysis by country
- 6.5. Retail and E-Commerce
- 6.5.1. Key market trends, growth factors and opportunities
- 6.5.2. Market size and forecast, by region
- 6.5.3. Market share analysis by country
- 6.6. Healthcare
- 6.6.1. Key market trends, growth factors and opportunities
- 6.6.2. Market size and forecast, by region
- 6.6.3. Market share analysis by country
- 6.7. Manufacturing
- 6.7.1. Key market trends, growth factors and opportunities
- 6.7.2. Market size and forecast, by region
- 6.7.3. Market share analysis by country
- 6.8. Law
- 6.8.1. Key market trends, growth factors and opportunities
- 6.8.2. Market size and forecast, by region
- 6.8.3. Market share analysis by country
- 6.9. Others
- 6.9.1. Key market trends, growth factors and opportunities
- 6.9.2. Market size and forecast, by region
- 6.9.3. Market share analysis by country
CHAPTER 7: DEEP LEARNING MARKET, BY REGION
- 7.1. Overview
- 7.1.1. Market size and forecast By Region
- 7.2. North America
- 7.2.1. Key market trends, growth factors and opportunities
- 7.2.2. Market size and forecast, by Component
- 7.2.3. Market size and forecast, by Application
- 7.2.4. Market size and forecast, by Industry Vertical
- 7.2.5. Market size and forecast, by country
- 7.2.5.1. U.S.
- 7.2.5.1.1. Market size and forecast, by Component
- 7.2.5.1.2. Market size and forecast, by Application
- 7.2.5.1.3. Market size and forecast, by Industry Vertical
- 7.2.5.2. Canada
- 7.2.5.2.1. Market size and forecast, by Component
- 7.2.5.2.2. Market size and forecast, by Application
- 7.2.5.2.3. Market size and forecast, by Industry Vertical
- 7.3. Europe
- 7.3.1. Key market trends, growth factors and opportunities
- 7.3.2. Market size and forecast, by Component
- 7.3.3. Market size and forecast, by Application
- 7.3.4. Market size and forecast, by Industry Vertical
- 7.3.5. Market size and forecast, by country
- 7.3.5.1. UK
- 7.3.5.1.1. Market size and forecast, by Component
- 7.3.5.1.2. Market size and forecast, by Application
- 7.3.5.1.3. Market size and forecast, by Industry Vertical
- 7.3.5.2. Germany
- 7.3.5.2.1. Market size and forecast, by Component
- 7.3.5.2.2. Market size and forecast, by Application
- 7.3.5.2.3. Market size and forecast, by Industry Vertical
- 7.3.5.3. France
- 7.3.5.3.1. Market size and forecast, by Component
- 7.3.5.3.2. Market size and forecast, by Application
- 7.3.5.3.3. Market size and forecast, by Industry Vertical
- 7.3.5.4. Italy
- 7.3.5.4.1. Market size and forecast, by Component
- 7.3.5.4.2. Market size and forecast, by Application
- 7.3.5.4.3. Market size and forecast, by Industry Vertical
- 7.3.5.5. Spain
- 7.3.5.5.1. Market size and forecast, by Component
- 7.3.5.5.2. Market size and forecast, by Application
- 7.3.5.5.3. Market size and forecast, by Industry Vertical
- 7.3.5.6. Rest of Europe
- 7.3.5.6.1. Market size and forecast, by Component
- 7.3.5.6.2. Market size and forecast, by Application
- 7.3.5.6.3. Market size and forecast, by Industry Vertical
- 7.4. Asia-Pacific
- 7.4.1. Key market trends, growth factors and opportunities
- 7.4.2. Market size and forecast, by Component
- 7.4.3. Market size and forecast, by Application
- 7.4.4. Market size and forecast, by Industry Vertical
- 7.4.5. Market size and forecast, by country
- 7.4.5.1. China
- 7.4.5.1.1. Market size and forecast, by Component
- 7.4.5.1.2. Market size and forecast, by Application
- 7.4.5.1.3. Market size and forecast, by Industry Vertical
- 7.4.5.2. Japan
- 7.4.5.2.1. Market size and forecast, by Component
- 7.4.5.2.2. Market size and forecast, by Application
- 7.4.5.2.3. Market size and forecast, by Industry Vertical
- 7.4.5.3. India
- 7.4.5.3.1. Market size and forecast, by Component
- 7.4.5.3.2. Market size and forecast, by Application
- 7.4.5.3.3. Market size and forecast, by Industry Vertical
- 7.4.5.4. Australia
- 7.4.5.4.1. Market size and forecast, by Component
- 7.4.5.4.2. Market size and forecast, by Application
- 7.4.5.4.3. Market size and forecast, by Industry Vertical
- 7.4.5.5. South Korea
- 7.4.5.5.1. Market size and forecast, by Component
- 7.4.5.5.2. Market size and forecast, by Application
- 7.4.5.5.3. Market size and forecast, by Industry Vertical
- 7.4.5.6. Rest of Asia-Pacific
- 7.4.5.6.1. Market size and forecast, by Component
- 7.4.5.6.2. Market size and forecast, by Application
- 7.4.5.6.3. Market size and forecast, by Industry Vertical
- 7.5. LAMEA
- 7.5.1. Key market trends, growth factors and opportunities
- 7.5.2. Market size and forecast, by Component
- 7.5.3. Market size and forecast, by Application
- 7.5.4. Market size and forecast, by Industry Vertical
- 7.5.5. Market size and forecast, by country
- 7.5.5.1. Latin America
- 7.5.5.1.1. Market size and forecast, by Component
- 7.5.5.1.2. Market size and forecast, by Application
- 7.5.5.1.3. Market size and forecast, by Industry Vertical
- 7.5.5.2. Middle East
- 7.5.5.2.1. Market size and forecast, by Component
- 7.5.5.2.2. Market size and forecast, by Application
- 7.5.5.2.3. Market size and forecast, by Industry Vertical
- 7.5.5.3. Africa
- 7.5.5.3.1. Market size and forecast, by Component
- 7.5.5.3.2. Market size and forecast, by Application
- 7.5.5.3.3. Market size and forecast, by Industry Vertical
CHAPTER 8: COMPETITIVE LANDSCAPE
- 8.1. Introduction
- 8.2. Top winning strategies
- 8.3. Product Mapping of Top 10 Player
- 8.4. Competitive Dashboard
- 8.5. Competitive Heatmap
- 8.6. Top player positioning, 2022
CHAPTER 9: COMPANY PROFILES
- 9.1. Advanced Micro Devices Inc.(Xilinx Inc.)
- 9.1.1. Company overview
- 9.1.2. Key Executives
- 9.1.3. Company snapshot
- 9.1.4. Operating business segments
- 9.1.5. Product portfolio
- 9.1.6. Business performance
- 9.1.7. Key strategic moves and developments
- 9.2. Amazon Web Services, Inc.
- 9.2.1. Company overview
- 9.2.2. Key Executives
- 9.2.3. Company snapshot
- 9.2.4. Operating business segments
- 9.2.5. Product portfolio
- 9.2.6. Business performance
- 9.2.7. Key strategic moves and developments
- 9.3. Google LLC
- 9.3.1. Company overview
- 9.3.2. Key Executives
- 9.3.3. Company snapshot
- 9.3.4. Operating business segments
- 9.3.5. Product portfolio
- 9.3.6. Business performance
- 9.3.7. Key strategic moves and developments
- 9.4. IBM Corporation
- 9.4.1. Company overview
- 9.4.2. Key Executives
- 9.4.3. Company snapshot
- 9.4.4. Operating business segments
- 9.4.5. Product portfolio
- 9.4.6. Business performance
- 9.4.7. Key strategic moves and developments
- 9.5. Intel Corporation
- 9.5.1. Company overview
- 9.5.2. Key Executives
- 9.5.3. Company snapshot
- 9.5.4. Operating business segments
- 9.5.5. Product portfolio
- 9.5.6. Business performance
- 9.5.7. Key strategic moves and developments
- 9.6. Microsoft Corporation
- 9.6.1. Company overview
- 9.6.2. Key Executives
- 9.6.3. Company snapshot
- 9.6.4. Operating business segments
- 9.6.5. Product portfolio
- 9.6.6. Business performance
- 9.6.7. Key strategic moves and developments
- 9.7. NVIDIA Corporation
- 9.7.1. Company overview
- 9.7.2. Key Executives
- 9.7.3. Company snapshot
- 9.7.4. Operating business segments
- 9.7.5. Product portfolio
- 9.7.6. Business performance
- 9.7.7. Key strategic moves and developments
- 9.8. Qualcomm Technologies, Inc.
- 9.8.1. Company overview
- 9.8.2. Key Executives
- 9.8.3. Company snapshot
- 9.8.4. Operating business segments
- 9.8.5. Product portfolio
- 9.8.6. Business performance
- 9.8.7. Key strategic moves and developments
- 9.9. Samsung
- 9.9.1. Company overview
- 9.9.2. Key Executives
- 9.9.3. Company snapshot
- 9.9.4. Operating business segments
- 9.9.5. Product portfolio
- 9.9.6. Business performance
- 9.9.7. Key strategic moves and developments
- 9.10. Xilinx
- 9.10.1. Company overview
- 9.10.2. Key Executives
- 9.10.3. Company snapshot
- 9.10.4. Operating business segments
- 9.10.5. Product portfolio
- 9.10.6. Business performance
- 9.10.7. Key strategic moves and developments