|
|
市場調査レポート
商品コード
1298171
位置情報サービス(LBS)市場:コンポーネント別、技術別、用途別、業種別:世界の機会分析と産業予測、2021年~2031年Location Based Services Market By Component, By Technology, By Application, By Industry Vertical : Global Opportunity Analysis and Industry Forecast, 2021-2031 |
||||||
|
|
|||||||


| 位置情報サービス(LBS)市場:コンポーネント別、技術別、用途別、業種別:世界の機会分析と産業予測、2021年~2031年 |
|
出版日: 2023年03月01日
発行: Allied Market Research
ページ情報: 英文 473 Pages
納期: 2~3営業日
|
- 全表示
- 概要
- 図表
- 目次
位置情報サービス(LBS)とは、モバイルデバイスやワイヤレスデバイスの正確な位置を特定するソフトウェアソリューションです。
さらに、これらのサービスは、ナビゲーションや物体、人、車両のモニタリング、位置情報のマーケティングに利用されます。スマートフォンのリアルタイムのジオデータポイントにLBSがアクセスし、情報、エンターテインメント、セキュリティデータを取得して後で処理することもできます。
ソーシャルメディア、スマートフォンの普及、GPSの容易な利用、位置情報技術の出現が、世界の位置情報サービス(LBS)市場の成長を後押ししています。また、スマートフォンユーザーの増加とインターネットへのアクセスは、位置情報サービス(LBS)市場の成長にプラスの影響を与えています。しかし、設置やメンテナンスにかかるコストの高さや運用上の課題が、位置情報サービス(LBS)市場の成長を妨げています。一方、3Gおよび4Gネットワークの普及とインターネットユーザーの継続的な増加は、予測期間中、位置情報サービス(LBS)市場の拡大に有益な機会を提供すると予想されます。
位置情報サービス(LBS)市場は、コンポーネント、技術、用途、業種別、地域別に区分されます。コンポーネント別では、ハードウェア、ソフトウェア、サービスに分類されます。技術別では、GPS、アシストGPS(A-GPS)、拡張GPS(E-GPS)、拡張観測時間差、観測時間差、セルID、Wi-Fi、その他に分けられます。用途別では、LBS市場は位置情報広告、ビジネスインテリジェンス・分析、車両管理、マッピング・ナビゲーション、ローカル検索・情報、ソーシャルネットワーキング・エンターテインメント、近接マーケティング、資産追跡、その他に分類されます。
目次
第1章 イントロダクション
第2章 エグゼクティブサマリー
第3章 市場概要
- 市場の定義と範囲
- 主な調査結果
- 影響要因
- 主な投資ポケット
- ポーターのファイブフォース分析
- 供給企業の交渉力
- 買い手の交渉力
- 代替品の脅威
- 新規参入業者の脅威
- 競合の激しさ
- 市場力学
- 促進要因
- ソーシャルメディア、スマートフォンの普及、GPSの容易な利用
- 位置情報技術の出現
- スマートフォンユーザーの増加とインターネットへのアクセス
- 阻害要因
- インストールとメンテナンスの高コスト
- 運用上の課題
- 機会
- 3Gおよび4Gネットワークの普及とインターネット・ユーザーの継続的増加
- 促進要因
- COVID-19:市場への影響分析
第4章 位置情報サービス(LBS)市場:コンポーネント別
- 概要
- 市場規模と予測
- ハードウェア
- 主要市場動向、成長要因、機会
- 市場規模・予測:地域別
- 市場シェア分析:国別
- ソフトウェア
- 主な市場動向、成長要因、機会
- 市場規模・予測:地域別
- 市場シェア分析:国別
- サービス
- 主な市場動向、成長要因、機会
- 市場規模・予測:地域別
- 市場シェア分析:国別
第5章 位置情報サービス(LBS)市場:技術別
- 概要
- 市場規模と予測
- GPS
- 主要市場動向、成長要因、機会
- 市場規模・予測:地域別
- 市場シェア分析:国別
- アシストGPS(A-GPS)
- 主な市場動向、成長要因、機会
- 市場規模・予測:地域別
- 市場シェア分析:国別
- 拡張GPS(E-GPS)
- 主な市場動向、成長要因、機会
- 市場規模・予測:地域別
- 市場シェア分析:国別
- 拡張観測時間差
- 主な市場動向、成長要因、機会
- 市場規模・予測:地域別
- 市場シェア分析:国別
- 観測時間差
- 主な市場動向、成長要因、機会
- 市場規模・予測:地域別
- 市場シェア分析:国別
- セルID
- 主な市場動向、成長要因、機会
- 市場規模・予測:地域別
- 市場シェア分析:国別
- Wi-Fi
- 主な市場動向、成長要因、機会
- 市場規模・予測:地域別
- 市場シェア分析:国別
- その他
- 主な市場動向、成長要因、機会
- 市場規模・予測:地域別
- 市場シェア分析:国別
第6章 位置情報サービス(LBS)市場:用途別
- 概要
- 市場規模と予測
- マッピング・ナビゲーション
- 主要市場動向、成長要因、機会
- 市場規模・予測:地域別
- 市場シェア分析:国別
- ビジネスインテリジェンス・分析
- 主な市場動向、成長要因、機会
- 市場規模・予測:地域別
- 市場シェア分析:国別
- フリート管理
- 主要市場動向、成長要因、機会
- 市場規模・予測:地域別
- 市場シェア分析:国別
- 位置情報広告
- 主な市場動向、成長要因、機会
- 市場規模・予測:地域別
- 市場シェア分析:国別
- ローカル検索・情報
- 主な市場動向、成長要因、機会
- 市場規模・予測:地域別
- 市場シェア分析:国別
- ソーシャルネットワーキング・エンターテインメント
- 主な市場動向、成長要因、機会
- 市場規模・予測:地域別
- 市場シェア分析:国別
- 近接マーケティング
- 主要市場動向、成長要因、機会
- 市場規模・予測:地域別
- 市場シェア分析:国別
- 資産追跡
- 主要市場動向、成長要因、機会
- 市場規模・予測:地域別
- 市場シェア分析:国別
- その他
- 主な市場動向、成長要因、機会
- 市場規模・予測:地域別
- 市場シェア分析:国別
第7章 位置情報サービス(LBS)市場:業種別
- 概要
- 市場規模と予測
- 輸送・物流
- 主要市場動向、成長要因、機会
- 市場規模・予測:地域別
- 市場シェア分析:国別
- 製造
- 主要市場動向、成長要因、機会
- 市場規模・予測:地域別
- 市場シェア分析:国別
- 政府・公益事業
- 主な市場動向、成長要因、機会
- 市場規模・予測:地域別
- 市場シェア分析:国別
- 小売
- 主要市場動向、成長要因、機会
- 市場規模・予測:地域別
- 市場シェア分析:国別
- ヘルスケア・ライフサイエンス
- 主要市場動向、成長要因、機会
- 市場規模・予測:地域別
- 市場シェア分析:国別
- メディア・エンターテインメント
- 主要市場動向、成長要因、機会
- 市場規模・予測:地域別
- 市場シェア分析:国別
- IT・通信
- 主な市場動向、成長要因、機会
- 市場規模・予測:地域別
- 市場シェア分析:国別
- BFSI
- 主な市場動向、成長要因、機会
- 市場規模・予測:地域別
- 市場シェア分析:国別
- ホスピタリティ
- 主要市場動向、成長要因、機会
- 市場規模・予測:地域別
- 市場シェア分析:国別
- その他
- 主な市場動向、成長要因、機会
- 市場規模・予測:地域別
- 市場シェア分析:国別
第8章 位置情報サービス(LBS)市場:地域別
- 概要
- 市場規模・予測:地域別
- 北米
- 主要動向と機会
- 市場規模・予測:コンポーネント別
- 市場規模・予測:技術別
- 市場規模・予測:用途別
- 市場規模・予測:業種別
- 市場規模・予測:国別
- 米国
- 主要市場動向、成長要因、機会
- 市場規模・予測:コンポーネント別
- 市場規模・予測:技術別
- 市場規模・予測:用途別
- 市場規模・予測:業種別
- カナダ
- 主要市場動向、成長要因、機会
- 市場規模・予測:コンポーネント別
- 市場規模・予測:技術別
- 市場規模・予測:用途別
- 市場規模・予測:業種別
- メキシコ
- 主要市場動向、成長要因、機会
- 市場規模・予測:コンポーネント別
- 市場規模・予測:技術別
- 市場規模・予測:用途別
- 市場規模・予測:業種別
- 欧州
- 主要動向と機会
- 市場規模・予測:コンポーネント別
- 市場規模・予測:技術別
- 市場規模・予測:用途別
- 市場規模・予測:業種別
- 市場規模・予測:国別
- 英国
- 主要市場動向、成長要因、機会
- 市場規模・予測:コンポーネント別
- 市場規模・予測:技術別
- 市場規模・予測:用途別
- 市場規模・予測:業種別
- ドイツ
- 主要市場動向、成長要因、機会
- 市場規模・予測:コンポーネント別
- 市場規模・予測:技術別
- 市場規模・予測:用途別
- 市場規模・予測:業種別
- フランス
- 主要市場動向、成長要因、機会
- 市場規模・予測:コンポーネント別
- 市場規模・予測:技術別
- 市場規模・予測:用途別
- 市場規模・予測:業種別
- スペイン
- 主要市場動向、成長要因、機会
- 市場規模・予測:コンポーネント別
- 市場規模・予測:技術別
- 市場規模・予測:用途別
- 市場規模・予測:業種別
- イタリア
- 主要市場動向、成長要因、機会
- 市場規模・予測:コンポーネント別
- 市場規模・予測:技術別
- 市場規模・予測:用途別
- 市場規模・予測:業種別
- その他欧州
- 主要市場動向、成長要因、機会
- 市場規模・予測:コンポーネント別
- 市場規模・予測:技術別
- 市場規模・予測:用途別
- 市場規模・予測:業種別
- アジア太平洋地域
- 主な動向と機会
- 市場規模・予測:コンポーネント別
- 市場規模・予測:技術別
- 市場規模・予測:用途別
- 市場規模・予測:業種別
- 市場規模・予測:国別
- 中国市場
- 主要市場動向、成長要因、機会
- 市場規模・予測:コンポーネント別
- 市場規模・予測:技術別
- 市場規模・予測:用途別
- 市場規模・予測:業種別
- 日本
- 主要市場動向、成長要因、機会
- 市場規模・予測:コンポーネント別
- 市場規模・予測:技術別
- 市場規模・予測:用途別
- 市場規模・予測:業種別
- インド市場
- 主要市場動向、成長要因、機会
- 市場規模・予測:コンポーネント別
- 市場規模・予測:技術別
- 市場規模・予測:用途別
- 市場規模・予測:業種別
- シンガポール
- 主要市場動向、成長要因、機会
- 市場規模・予測:コンポーネント別
- 市場規模・予測:技術別
- 市場規模・予測:用途別
- 市場規模・予測:業種別
- 韓国
- 主要市場動向、成長要因、機会
- 市場規模・予測:コンポーネント別
- 市場規模・予測:技術別
- 市場規模・予測:用途別
- 市場規模・予測:業種別
- その他アジア太平洋地域
- 主要市場動向、成長要因、機会
- 市場規模・予測:コンポーネント別
- 市場規模・予測:技術別
- 市場規模・予測:用途別
- 市場規模・予測:業種別
- ラテンアメリカ・中東・アフリカ
- 主要動向と機会
- 市場規模・予測:コンポーネント別
- 市場規模・予測:技術別
- 市場規模・予測:用途別
- 市場規模・予測:業種別
- 市場規模・予測:国別
- ラテンアメリカ
- 主要市場動向、成長要因、機会
- 市場規模・予測:コンポーネント別
- 市場規模・予測:技術別
- 市場規模・予測:用途別
- 市場規模・予測:業種別
- 中東
- 主要市場動向、成長要因、機会
- 市場規模・予測:コンポーネント別
- 市場規模・予測:技術別
- 市場規模・予測:用途別
- 市場規模・予測:業種別
- アフリカ市場
- 主要市場動向、成長要因、機会
- 市場規模・予測:コンポーネント別
- 市場規模・予測:技術別
- 市場規模・予測:用途別
- 市場規模・予測:業種別
第9章 競合情勢
- イントロダクション
- 主要成功戦略
- 主要10社の製品マッピング
- 競合ダッシュボード
- 競合ヒートマップ
- トップ企業のポジショニング(2021年
第10章 企業プロファイル
- ALE International
- Apple, Inc.
- AT&T Inc.
- Airtel India.
- Cisco Systems, Inc.
- Google LLC
- HERE
- IBM Corporation
- Microsoft Corporation
- Oracle Corporation
- Qualcomm Technologies, Inc.
LIST OF TABLES
- TABLE 01. GLOBAL LOCATION BASED SERVICES MARKET, BY COMPONENT, 2021-2031 ($MILLION)
- TABLE 02. LOCATION BASED SERVICES MARKET FOR HARDWARE, BY REGION, 2021-2031 ($MILLION)
- TABLE 03. LOCATION BASED SERVICES MARKET FOR SOFTWARE, BY REGION, 2021-2031 ($MILLION)
- TABLE 04. LOCATION BASED SERVICES MARKET FOR SERVICES, BY REGION, 2021-2031 ($MILLION)
- TABLE 05. GLOBAL LOCATION BASED SERVICES MARKET, BY TECHNOLOGY, 2021-2031 ($MILLION)
- TABLE 06. LOCATION BASED SERVICES MARKET FOR GPS, BY REGION, 2021-2031 ($MILLION)
- TABLE 07. LOCATION BASED SERVICES MARKET FOR ASSISTED GPS (A-GPS), BY REGION, 2021-2031 ($MILLION)
- TABLE 08. LOCATION BASED SERVICES MARKET FOR ENHANCED GPS (E-GPS), BY REGION, 2021-2031 ($MILLION)
- TABLE 09. LOCATION BASED SERVICES MARKET FOR ENHANCED OBSERVED TIME DIFFERENCE, BY REGION, 2021-2031 ($MILLION)
- TABLE 10. LOCATION BASED SERVICES MARKET FOR OBSERVED TIME DIFFERENCE, BY REGION, 2021-2031 ($MILLION)
- TABLE 11. LOCATION BASED SERVICES MARKET FOR CELL ID, BY REGION, 2021-2031 ($MILLION)
- TABLE 12. LOCATION BASED SERVICES MARKET FOR WI-FI, BY REGION, 2021-2031 ($MILLION)
- TABLE 13. LOCATION BASED SERVICES MARKET FOR OTHERS, BY REGION, 2021-2031 ($MILLION)
- TABLE 14. GLOBAL LOCATION BASED SERVICES MARKET, BY APPLICATION, 2021-2031 ($MILLION)
- TABLE 15. LOCATION BASED SERVICES MARKET FOR MAPPING AND NAVIGATION, BY REGION, 2021-2031 ($MILLION)
- TABLE 16. LOCATION BASED SERVICES MARKET FOR BUSINESS INTELLIGENCE AND ANALYTICS, BY REGION, 2021-2031 ($MILLION)
- TABLE 17. LOCATION BASED SERVICES MARKET FOR FLEET MANAGEMENT, BY REGION, 2021-2031 ($MILLION)
- TABLE 18. LOCATION BASED SERVICES MARKET FOR LOCATION-BASED ADVERTISING, BY REGION, 2021-2031 ($MILLION)
- TABLE 19. LOCATION BASED SERVICES MARKET FOR LOCAL SEARCH AND INFORMATION, BY REGION, 2021-2031 ($MILLION)
- TABLE 20. LOCATION BASED SERVICES MARKET FOR SOCIAL NETWORKING AND ENTERTAINMENT, BY REGION, 2021-2031 ($MILLION)
- TABLE 21. LOCATION BASED SERVICES MARKET FOR PROXIMITY MARKETING, BY REGION, 2021-2031 ($MILLION)
- TABLE 22. LOCATION BASED SERVICES MARKET FOR ASSET TRACKING, BY REGION, 2021-2031 ($MILLION)
- TABLE 23. LOCATION BASED SERVICES MARKET FOR OTHERS, BY REGION, 2021-2031 ($MILLION)
- TABLE 24. GLOBAL LOCATION BASED SERVICES MARKET, BY INDUSTRY VERTICAL, 2021-2031 ($MILLION)
- TABLE 25. LOCATION BASED SERVICES MARKET FOR TRANSPORTATION AND LOGISTICS, BY REGION, 2021-2031 ($MILLION)
- TABLE 26. LOCATION BASED SERVICES MARKET FOR MANUFACTURING, BY REGION, 2021-2031 ($MILLION)
- TABLE 27. LOCATION BASED SERVICES MARKET FOR GOVERNMENT AND PUBLIC UTILITIES, BY REGION, 2021-2031 ($MILLION)
- TABLE 28. LOCATION BASED SERVICES MARKET FOR RETAIL, BY REGION, 2021-2031 ($MILLION)
- TABLE 29. LOCATION BASED SERVICES MARKET FOR HEALTHCARE AND LIFE SCIENCES, BY REGION, 2021-2031 ($MILLION)
- TABLE 30. LOCATION BASED SERVICES MARKET FOR MEDIA AND ENTERTAINMENT, BY REGION, 2021-2031 ($MILLION)
- TABLE 31. LOCATION BASED SERVICES MARKET FOR IT AND TELECOM, BY REGION, 2021-2031 ($MILLION)
- TABLE 32. LOCATION BASED SERVICES MARKET FOR BFSI, BY REGION, 2021-2031 ($MILLION)
- TABLE 33. LOCATION BASED SERVICES MARKET FOR HOSPITALITY, BY REGION, 2021-2031 ($MILLION)
- TABLE 34. LOCATION BASED SERVICES MARKET FOR OTHERS, BY REGION, 2021-2031 ($MILLION)
- TABLE 35. LOCATION BASED SERVICES MARKET, BY REGION, 2021-2031 ($MILLION)
- TABLE 36. NORTH AMERICA LOCATION BASED SERVICES MARKET, BY COMPONENT, 2021-2031 ($MILLION)
- TABLE 37. NORTH AMERICA LOCATION BASED SERVICES MARKET, BY TECHNOLOGY, 2021-2031 ($MILLION)
- TABLE 38. NORTH AMERICA LOCATION BASED SERVICES MARKET, BY APPLICATION, 2021-2031 ($MILLION)
- TABLE 39. NORTH AMERICA LOCATION BASED SERVICES MARKET, BY INDUSTRY VERTICAL, 2021-2031 ($MILLION)
- TABLE 40. NORTH AMERICA LOCATION BASED SERVICES MARKET, BY COUNTRY, 2021-2031 ($MILLION)
- TABLE 41. U.S. LOCATION BASED SERVICES MARKET, BY COMPONENT, 2021-2031 ($MILLION)
- TABLE 42. U.S. LOCATION BASED SERVICES MARKET, BY TECHNOLOGY, 2021-2031 ($MILLION)
- TABLE 43. U.S. LOCATION BASED SERVICES MARKET, BY APPLICATION, 2021-2031 ($MILLION)
- TABLE 44. U.S. LOCATION BASED SERVICES MARKET, BY INDUSTRY VERTICAL, 2021-2031 ($MILLION)
- TABLE 45. CANADA LOCATION BASED SERVICES MARKET, BY COMPONENT, 2021-2031 ($MILLION)
- TABLE 46. CANADA LOCATION BASED SERVICES MARKET, BY TECHNOLOGY, 2021-2031 ($MILLION)
- TABLE 47. CANADA LOCATION BASED SERVICES MARKET, BY APPLICATION, 2021-2031 ($MILLION)
- TABLE 48. CANADA LOCATION BASED SERVICES MARKET, BY INDUSTRY VERTICAL, 2021-2031 ($MILLION)
- TABLE 49. MEXICO LOCATION BASED SERVICES MARKET, BY COMPONENT, 2021-2031 ($MILLION)
- TABLE 50. MEXICO LOCATION BASED SERVICES MARKET, BY TECHNOLOGY, 2021-2031 ($MILLION)
- TABLE 51. MEXICO LOCATION BASED SERVICES MARKET, BY APPLICATION, 2021-2031 ($MILLION)
- TABLE 52. MEXICO LOCATION BASED SERVICES MARKET, BY INDUSTRY VERTICAL, 2021-2031 ($MILLION)
- TABLE 53. EUROPE LOCATION BASED SERVICES MARKET, BY COMPONENT, 2021-2031 ($MILLION)
- TABLE 54. EUROPE LOCATION BASED SERVICES MARKET, BY TECHNOLOGY, 2021-2031 ($MILLION)
- TABLE 55. EUROPE LOCATION BASED SERVICES MARKET, BY APPLICATION, 2021-2031 ($MILLION)
- TABLE 56. EUROPE LOCATION BASED SERVICES MARKET, BY INDUSTRY VERTICAL, 2021-2031 ($MILLION)
- TABLE 57. EUROPE LOCATION BASED SERVICES MARKET, BY COUNTRY, 2021-2031 ($MILLION)
- TABLE 58. UK LOCATION BASED SERVICES MARKET, BY COMPONENT, 2021-2031 ($MILLION)
- TABLE 59. UK LOCATION BASED SERVICES MARKET, BY TECHNOLOGY, 2021-2031 ($MILLION)
- TABLE 60. UK LOCATION BASED SERVICES MARKET, BY APPLICATION, 2021-2031 ($MILLION)
- TABLE 61. UK LOCATION BASED SERVICES MARKET, BY INDUSTRY VERTICAL, 2021-2031 ($MILLION)
- TABLE 62. GERMANY LOCATION BASED SERVICES MARKET, BY COMPONENT, 2021-2031 ($MILLION)
- TABLE 63. GERMANY LOCATION BASED SERVICES MARKET, BY TECHNOLOGY, 2021-2031 ($MILLION)
- TABLE 64. GERMANY LOCATION BASED SERVICES MARKET, BY APPLICATION, 2021-2031 ($MILLION)
- TABLE 65. GERMANY LOCATION BASED SERVICES MARKET, BY INDUSTRY VERTICAL, 2021-2031 ($MILLION)
- TABLE 66. FRANCE LOCATION BASED SERVICES MARKET, BY COMPONENT, 2021-2031 ($MILLION)
- TABLE 67. FRANCE LOCATION BASED SERVICES MARKET, BY TECHNOLOGY, 2021-2031 ($MILLION)
- TABLE 68. FRANCE LOCATION BASED SERVICES MARKET, BY APPLICATION, 2021-2031 ($MILLION)
- TABLE 69. FRANCE LOCATION BASED SERVICES MARKET, BY INDUSTRY VERTICAL, 2021-2031 ($MILLION)
- TABLE 70. SPAIN LOCATION BASED SERVICES MARKET, BY COMPONENT, 2021-2031 ($MILLION)
- TABLE 71. SPAIN LOCATION BASED SERVICES MARKET, BY TECHNOLOGY, 2021-2031 ($MILLION)
- TABLE 72. SPAIN LOCATION BASED SERVICES MARKET, BY APPLICATION, 2021-2031 ($MILLION)
- TABLE 73. SPAIN LOCATION BASED SERVICES MARKET, BY INDUSTRY VERTICAL, 2021-2031 ($MILLION)
- TABLE 74. ITALY LOCATION BASED SERVICES MARKET, BY COMPONENT, 2021-2031 ($MILLION)
- TABLE 75. ITALY LOCATION BASED SERVICES MARKET, BY TECHNOLOGY, 2021-2031 ($MILLION)
- TABLE 76. ITALY LOCATION BASED SERVICES MARKET, BY APPLICATION, 2021-2031 ($MILLION)
- TABLE 77. ITALY LOCATION BASED SERVICES MARKET, BY INDUSTRY VERTICAL, 2021-2031 ($MILLION)
- TABLE 78. REST OF EUROPE LOCATION BASED SERVICES MARKET, BY COMPONENT, 2021-2031 ($MILLION)
- TABLE 79. REST OF EUROPE LOCATION BASED SERVICES MARKET, BY TECHNOLOGY, 2021-2031 ($MILLION)
- TABLE 80. REST OF EUROPE LOCATION BASED SERVICES MARKET, BY APPLICATION, 2021-2031 ($MILLION)
- TABLE 81. REST OF EUROPE LOCATION BASED SERVICES MARKET, BY INDUSTRY VERTICAL, 2021-2031 ($MILLION)
- TABLE 82. ASIA-PACIFIC LOCATION BASED SERVICES MARKET, BY COMPONENT, 2021-2031 ($MILLION)
- TABLE 83. ASIA-PACIFIC LOCATION BASED SERVICES MARKET, BY TECHNOLOGY, 2021-2031 ($MILLION)
- TABLE 84. ASIA-PACIFIC LOCATION BASED SERVICES MARKET, BY APPLICATION, 2021-2031 ($MILLION)
- TABLE 85. ASIA-PACIFIC LOCATION BASED SERVICES MARKET, BY INDUSTRY VERTICAL, 2021-2031 ($MILLION)
- TABLE 86. ASIA-PACIFIC LOCATION BASED SERVICES MARKET, BY COUNTRY, 2021-2031 ($MILLION)
- TABLE 87. CHINA LOCATION BASED SERVICES MARKET, BY COMPONENT, 2021-2031 ($MILLION)
- TABLE 88. CHINA LOCATION BASED SERVICES MARKET, BY TECHNOLOGY, 2021-2031 ($MILLION)
- TABLE 89. CHINA LOCATION BASED SERVICES MARKET, BY APPLICATION, 2021-2031 ($MILLION)
- TABLE 90. CHINA LOCATION BASED SERVICES MARKET, BY INDUSTRY VERTICAL, 2021-2031 ($MILLION)
- TABLE 91. JAPAN LOCATION BASED SERVICES MARKET, BY COMPONENT, 2021-2031 ($MILLION)
- TABLE 92. JAPAN LOCATION BASED SERVICES MARKET, BY TECHNOLOGY, 2021-2031 ($MILLION)
- TABLE 93. JAPAN LOCATION BASED SERVICES MARKET, BY APPLICATION, 2021-2031 ($MILLION)
- TABLE 94. JAPAN LOCATION BASED SERVICES MARKET, BY INDUSTRY VERTICAL, 2021-2031 ($MILLION)
- TABLE 95. INDIA LOCATION BASED SERVICES MARKET, BY COMPONENT, 2021-2031 ($MILLION)
- TABLE 96. INDIA LOCATION BASED SERVICES MARKET, BY TECHNOLOGY, 2021-2031 ($MILLION)
- TABLE 97. INDIA LOCATION BASED SERVICES MARKET, BY APPLICATION, 2021-2031 ($MILLION)
- TABLE 98. INDIA LOCATION BASED SERVICES MARKET, BY INDUSTRY VERTICAL, 2021-2031 ($MILLION)
- TABLE 99. SINGAPORE LOCATION BASED SERVICES MARKET, BY COMPONENT, 2021-2031 ($MILLION)
- TABLE 100. SINGAPORE LOCATION BASED SERVICES MARKET, BY TECHNOLOGY, 2021-2031 ($MILLION)
- TABLE 101. SINGAPORE LOCATION BASED SERVICES MARKET, BY APPLICATION, 2021-2031 ($MILLION)
- TABLE 102. SINGAPORE LOCATION BASED SERVICES MARKET, BY INDUSTRY VERTICAL, 2021-2031 ($MILLION)
- TABLE 103. SOUTH KOREA LOCATION BASED SERVICES MARKET, BY COMPONENT, 2021-2031 ($MILLION)
- TABLE 104. SOUTH KOREA LOCATION BASED SERVICES MARKET, BY TECHNOLOGY, 2021-2031 ($MILLION)
- TABLE 105. SOUTH KOREA LOCATION BASED SERVICES MARKET, BY APPLICATION, 2021-2031 ($MILLION)
- TABLE 106. SOUTH KOREA LOCATION BASED SERVICES MARKET, BY INDUSTRY VERTICAL, 2021-2031 ($MILLION)
- TABLE 107. REST OF ASIA-PACIFIC LOCATION BASED SERVICES MARKET, BY COMPONENT, 2021-2031 ($MILLION)
- TABLE 108. REST OF ASIA-PACIFIC LOCATION BASED SERVICES MARKET, BY TECHNOLOGY, 2021-2031 ($MILLION)
- TABLE 109. REST OF ASIA-PACIFIC LOCATION BASED SERVICES MARKET, BY APPLICATION, 2021-2031 ($MILLION)
- TABLE 110. REST OF ASIA-PACIFIC LOCATION BASED SERVICES MARKET, BY INDUSTRY VERTICAL, 2021-2031 ($MILLION)
- TABLE 111. LAMEA LOCATION BASED SERVICES MARKET, BY COMPONENT, 2021-2031 ($MILLION)
- TABLE 112. LAMEA LOCATION BASED SERVICES MARKET, BY TECHNOLOGY, 2021-2031 ($MILLION)
- TABLE 113. LAMEA LOCATION BASED SERVICES MARKET, BY APPLICATION, 2021-2031 ($MILLION)
- TABLE 114. LAMEA LOCATION BASED SERVICES MARKET, BY INDUSTRY VERTICAL, 2021-2031 ($MILLION)
- TABLE 115. LAMEA LOCATION BASED SERVICES MARKET, BY COUNTRY, 2021-2031 ($MILLION)
- TABLE 116. LATIN AMERICA LOCATION BASED SERVICES MARKET, BY COMPONENT, 2021-2031 ($MILLION)
- TABLE 117. LATIN AMERICA LOCATION BASED SERVICES MARKET, BY TECHNOLOGY, 2021-2031 ($MILLION)
- TABLE 118. LATIN AMERICA LOCATION BASED SERVICES MARKET, BY APPLICATION, 2021-2031 ($MILLION)
- TABLE 119. LATIN AMERICA LOCATION BASED SERVICES MARKET, BY INDUSTRY VERTICAL, 2021-2031 ($MILLION)
- TABLE 120. MIDDLE EAST LOCATION BASED SERVICES MARKET, BY COMPONENT, 2021-2031 ($MILLION)
- TABLE 121. MIDDLE EAST LOCATION BASED SERVICES MARKET, BY TECHNOLOGY, 2021-2031 ($MILLION)
- TABLE 122. MIDDLE EAST LOCATION BASED SERVICES MARKET, BY APPLICATION, 2021-2031 ($MILLION)
- TABLE 123. MIDDLE EAST LOCATION BASED SERVICES MARKET, BY INDUSTRY VERTICAL, 2021-2031 ($MILLION)
- TABLE 124. AFRICA LOCATION BASED SERVICES MARKET, BY COMPONENT, 2021-2031 ($MILLION)
- TABLE 125. AFRICA LOCATION BASED SERVICES MARKET, BY TECHNOLOGY, 2021-2031 ($MILLION)
- TABLE 126. AFRICA LOCATION BASED SERVICES MARKET, BY APPLICATION, 2021-2031 ($MILLION)
- TABLE 127. AFRICA LOCATION BASED SERVICES MARKET, BY INDUSTRY VERTICAL, 2021-2031 ($MILLION)
- TABLE 128. ALE INTERNATIONAL: KEY EXECUTIVES
- TABLE 129. ALE INTERNATIONAL: COMPANY SNAPSHOT
- TABLE 130. ALE INTERNATIONAL: PRODUCT SEGMENTS
- TABLE 131. ALE INTERNATIONAL: PRODUCT PORTFOLIO
- TABLE 132. ALE INTERNATIONAL: KEY STRATERGIES
- TABLE 133. APPLE, INC.: KEY EXECUTIVES
- TABLE 134. APPLE, INC.: COMPANY SNAPSHOT
- TABLE 135. APPLE, INC.: SERVICE SEGMENTS
- TABLE 136. APPLE, INC.: PRODUCT PORTFOLIO
- TABLE 137. APPLE, INC.: KEY STRATERGIES
- TABLE 138. AT&T INC.: KEY EXECUTIVES
- TABLE 139. AT&T INC.: COMPANY SNAPSHOT
- TABLE 140. AT&T INC.: PRODUCT SEGMENTS
- TABLE 141. AT&T INC.: PRODUCT PORTFOLIO
- TABLE 142. AT&T INC.: KEY STRATERGIES
- TABLE 143. AIRTEL INDIA.: KEY EXECUTIVES
- TABLE 144. AIRTEL INDIA.: COMPANY SNAPSHOT
- TABLE 145. AIRTEL INDIA.: SERVICE SEGMENTS
- TABLE 146. AIRTEL INDIA.: PRODUCT PORTFOLIO
- TABLE 147. AIRTEL INDIA.: KEY STRATERGIES
- TABLE 148. CISCO SYSTEMS, INC.: KEY EXECUTIVES
- TABLE 149. CISCO SYSTEMS, INC.: COMPANY SNAPSHOT
- TABLE 150. CISCO SYSTEMS, INC.: SERVICE SEGMENTS
- TABLE 151. CISCO SYSTEMS, INC.: PRODUCT PORTFOLIO
- TABLE 152. CISCO SYSTEMS, INC.: KEY STRATERGIES
- TABLE 153. GOOGLE LLC: KEY EXECUTIVES
- TABLE 154. GOOGLE LLC: COMPANY SNAPSHOT
- TABLE 155. GOOGLE LLC: SERVICE SEGMENTS
- TABLE 156. GOOGLE LLC: PRODUCT PORTFOLIO
- TABLE 157. GOOGLE LLC: KEY STRATERGIES
- TABLE 158. HERE: KEY EXECUTIVES
- TABLE 159. HERE: COMPANY SNAPSHOT
- TABLE 160. HERE: PRODUCT SEGMENTS
- TABLE 161. HERE: PRODUCT PORTFOLIO
- TABLE 162. HERE: KEY STRATERGIES
- TABLE 163. IBM CORPORATION: KEY EXECUTIVES
- TABLE 164. IBM CORPORATION: COMPANY SNAPSHOT
- TABLE 165. IBM CORPORATION: SERVICE SEGMENTS
- TABLE 166. IBM CORPORATION: PRODUCT PORTFOLIO
- TABLE 167. IBM CORPORATION: KEY STRATERGIES
- TABLE 168. MICROSOFT CORPORATION: KEY EXECUTIVES
- TABLE 169. MICROSOFT CORPORATION: COMPANY SNAPSHOT
- TABLE 170. MICROSOFT CORPORATION: SERVICE SEGMENTS
- TABLE 171. MICROSOFT CORPORATION: PRODUCT PORTFOLIO
- TABLE 172. MICROSOFT CORPORATION: KEY STRATERGIES
- TABLE 173. ORACLE CORPORATION: KEY EXECUTIVES
- TABLE 174. ORACLE CORPORATION: COMPANY SNAPSHOT
- TABLE 175. ORACLE CORPORATION: PRODUCT SEGMENTS
- TABLE 176. ORACLE CORPORATION: PRODUCT PORTFOLIO
- TABLE 177. ORACLE CORPORATION: KEY STRATERGIES
- TABLE 178. QUALCOMM TECHNOLOGIES, INC. : KEY EXECUTIVES
- TABLE 179. QUALCOMM TECHNOLOGIES, INC. : COMPANY SNAPSHOT
- TABLE 180. QUALCOMM TECHNOLOGIES, INC. : SERVICE SEGMENTS
- TABLE 181. QUALCOMM TECHNOLOGIES, INC. : PRODUCT PORTFOLIO
- TABLE 182. QUALCOMM TECHNOLOGIES, INC. : KEY STRATERGIES
LIST OF FIGURES
- FIGURE 01. LOCATION BASED SERVICES MARKET, 2021-2031
- FIGURE 02. SEGMENTATION OF LOCATION BASED SERVICES MARKET, 2021-2031
- FIGURE 03. TOP INVESTMENT POCKETS IN LOCATION BASED SERVICES MARKET (2022-2031)
- FIGURE 04. LOW BARGAINING POWER OF SUPPLIERS
- FIGURE 05. LOW BARGAINING POWER OF BUYERS
- FIGURE 06. LOW THREAT OF SUBSTITUTES
- FIGURE 07. LOW THREAT OF NEW ENTRANTS
- FIGURE 08. LOW INTENSITY OF RIVALRY
- FIGURE 09. DRIVERS, RESTRAINTS AND OPPORTUNITIES: GLOBALLOCATION BASED SERVICES MARKET
- FIGURE 10. LOCATION BASED SERVICES MARKET, BY COMPONENT, 2021(%)
- FIGURE 11. COMPARATIVE SHARE ANALYSIS OF LOCATION BASED SERVICES MARKET FOR HARDWARE, BY COUNTRY 2021 AND 2031(%)
- FIGURE 12. COMPARATIVE SHARE ANALYSIS OF LOCATION BASED SERVICES MARKET FOR SOFTWARE, BY COUNTRY 2021 AND 2031(%)
- FIGURE 13. COMPARATIVE SHARE ANALYSIS OF LOCATION BASED SERVICES MARKET FOR SERVICES, BY COUNTRY 2021 AND 2031(%)
- FIGURE 14. LOCATION BASED SERVICES MARKET, BY TECHNOLOGY, 2021(%)
- FIGURE 15. COMPARATIVE SHARE ANALYSIS OF LOCATION BASED SERVICES MARKET FOR GPS, BY COUNTRY 2021 AND 2031(%)
- FIGURE 16. COMPARATIVE SHARE ANALYSIS OF LOCATION BASED SERVICES MARKET FOR ASSISTED GPS (A-GPS), BY COUNTRY 2021 AND 2031(%)
- FIGURE 17. COMPARATIVE SHARE ANALYSIS OF LOCATION BASED SERVICES MARKET FOR ENHANCED GPS (E-GPS), BY COUNTRY 2021 AND 2031(%)
- FIGURE 18. COMPARATIVE SHARE ANALYSIS OF LOCATION BASED SERVICES MARKET FOR ENHANCED OBSERVED TIME DIFFERENCE, BY COUNTRY 2021 AND 2031(%)
- FIGURE 19. COMPARATIVE SHARE ANALYSIS OF LOCATION BASED SERVICES MARKET FOR OBSERVED TIME DIFFERENCE, BY COUNTRY 2021 AND 2031(%)
- FIGURE 20. COMPARATIVE SHARE ANALYSIS OF LOCATION BASED SERVICES MARKET FOR CELL ID, BY COUNTRY 2021 AND 2031(%)
- FIGURE 21. COMPARATIVE SHARE ANALYSIS OF LOCATION BASED SERVICES MARKET FOR WI-FI, BY COUNTRY 2021 AND 2031(%)
- FIGURE 22. COMPARATIVE SHARE ANALYSIS OF LOCATION BASED SERVICES MARKET FOR OTHERS, BY COUNTRY 2021 AND 2031(%)
- FIGURE 23. LOCATION BASED SERVICES MARKET, BY APPLICATION, 2021(%)
- FIGURE 24. COMPARATIVE SHARE ANALYSIS OF LOCATION BASED SERVICES MARKET FOR MAPPING AND NAVIGATION, BY COUNTRY 2021 AND 2031(%)
- FIGURE 25. COMPARATIVE SHARE ANALYSIS OF LOCATION BASED SERVICES MARKET FOR BUSINESS INTELLIGENCE AND ANALYTICS, BY COUNTRY 2021 AND 2031(%)
- FIGURE 26. COMPARATIVE SHARE ANALYSIS OF LOCATION BASED SERVICES MARKET FOR FLEET MANAGEMENT, BY COUNTRY 2021 AND 2031(%)
- FIGURE 27. COMPARATIVE SHARE ANALYSIS OF LOCATION BASED SERVICES MARKET FOR LOCATION-BASED ADVERTISING, BY COUNTRY 2021 AND 2031(%)
- FIGURE 28. COMPARATIVE SHARE ANALYSIS OF LOCATION BASED SERVICES MARKET FOR LOCAL SEARCH AND INFORMATION, BY COUNTRY 2021 AND 2031(%)
- FIGURE 29. COMPARATIVE SHARE ANALYSIS OF LOCATION BASED SERVICES MARKET FOR SOCIAL NETWORKING AND ENTERTAINMENT, BY COUNTRY 2021 AND 2031(%)
- FIGURE 30. COMPARATIVE SHARE ANALYSIS OF LOCATION BASED SERVICES MARKET FOR PROXIMITY MARKETING, BY COUNTRY 2021 AND 2031(%)
- FIGURE 31. COMPARATIVE SHARE ANALYSIS OF LOCATION BASED SERVICES MARKET FOR ASSET TRACKING, BY COUNTRY 2021 AND 2031(%)
- FIGURE 32. COMPARATIVE SHARE ANALYSIS OF LOCATION BASED SERVICES MARKET FOR OTHERS, BY COUNTRY 2021 AND 2031(%)
- FIGURE 33. LOCATION BASED SERVICES MARKET, BY INDUSTRY VERTICAL, 2021(%)
- FIGURE 34. COMPARATIVE SHARE ANALYSIS OF LOCATION BASED SERVICES MARKET FOR TRANSPORTATION AND LOGISTICS, BY COUNTRY 2021 AND 2031(%)
- FIGURE 35. COMPARATIVE SHARE ANALYSIS OF LOCATION BASED SERVICES MARKET FOR MANUFACTURING, BY COUNTRY 2021 AND 2031(%)
- FIGURE 36. COMPARATIVE SHARE ANALYSIS OF LOCATION BASED SERVICES MARKET FOR GOVERNMENT AND PUBLIC UTILITIES, BY COUNTRY 2021 AND 2031(%)
- FIGURE 37. COMPARATIVE SHARE ANALYSIS OF LOCATION BASED SERVICES MARKET FOR RETAIL, BY COUNTRY 2021 AND 2031(%)
- FIGURE 38. COMPARATIVE SHARE ANALYSIS OF LOCATION BASED SERVICES MARKET FOR HEALTHCARE AND LIFE SCIENCES, BY COUNTRY 2021 AND 2031(%)
- FIGURE 39. COMPARATIVE SHARE ANALYSIS OF LOCATION BASED SERVICES MARKET FOR MEDIA AND ENTERTAINMENT, BY COUNTRY 2021 AND 2031(%)
- FIGURE 40. COMPARATIVE SHARE ANALYSIS OF LOCATION BASED SERVICES MARKET FOR IT AND TELECOM, BY COUNTRY 2021 AND 2031(%)
- FIGURE 41. COMPARATIVE SHARE ANALYSIS OF LOCATION BASED SERVICES MARKET FOR BFSI, BY COUNTRY 2021 AND 2031(%)
- FIGURE 42. COMPARATIVE SHARE ANALYSIS OF LOCATION BASED SERVICES MARKET FOR HOSPITALITY, BY COUNTRY 2021 AND 2031(%)
- FIGURE 43. COMPARATIVE SHARE ANALYSIS OF LOCATION BASED SERVICES MARKET FOR OTHERS, BY COUNTRY 2021 AND 2031(%)
- FIGURE 44. LOCATION BASED SERVICES MARKET BY REGION, 2021
- FIGURE 45. U.S. LOCATION BASED SERVICES MARKET, 2021-2031 ($MILLION)
- FIGURE 46. CANADA LOCATION BASED SERVICES MARKET, 2021-2031 ($MILLION)
- FIGURE 47. MEXICO LOCATION BASED SERVICES MARKET, 2021-2031 ($MILLION)
- FIGURE 48. UK LOCATION BASED SERVICES MARKET, 2021-2031 ($MILLION)
- FIGURE 49. GERMANY LOCATION BASED SERVICES MARKET, 2021-2031 ($MILLION)
- FIGURE 50. FRANCE LOCATION BASED SERVICES MARKET, 2021-2031 ($MILLION)
- FIGURE 51. SPAIN LOCATION BASED SERVICES MARKET, 2021-2031 ($MILLION)
- FIGURE 52. ITALY LOCATION BASED SERVICES MARKET, 2021-2031 ($MILLION)
- FIGURE 53. REST OF EUROPE LOCATION BASED SERVICES MARKET, 2021-2031 ($MILLION)
- FIGURE 54. CHINA LOCATION BASED SERVICES MARKET, 2021-2031 ($MILLION)
- FIGURE 55. JAPAN LOCATION BASED SERVICES MARKET, 2021-2031 ($MILLION)
- FIGURE 56. INDIA LOCATION BASED SERVICES MARKET, 2021-2031 ($MILLION)
- FIGURE 57. SINGAPORE LOCATION BASED SERVICES MARKET, 2021-2031 ($MILLION)
- FIGURE 58. SOUTH KOREA LOCATION BASED SERVICES MARKET, 2021-2031 ($MILLION)
- FIGURE 59. REST OF ASIA-PACIFIC LOCATION BASED SERVICES MARKET, 2021-2031 ($MILLION)
- FIGURE 60. LATIN AMERICA LOCATION BASED SERVICES MARKET, 2021-2031 ($MILLION)
- FIGURE 61. MIDDLE EAST LOCATION BASED SERVICES MARKET, 2021-2031 ($MILLION)
- FIGURE 62. AFRICA LOCATION BASED SERVICES MARKET, 2021-2031 ($MILLION)
- FIGURE 63. TOP WINNING STRATEGIES, BY YEAR
- FIGURE 64. TOP WINNING STRATEGIES, BY DEVELOPMENT
- FIGURE 65. TOP WINNING STRATEGIES, BY COMPANY
- FIGURE 66. PRODUCT MAPPING OF TOP 10 PLAYERS
- FIGURE 67. COMPETITIVE DASHBOARD
- FIGURE 68. COMPETITIVE HEATMAP: LOCATION BASED SERVICES MARKET
- FIGURE 69. TOP PLAYER POSITIONING, 2021
- FIGURE 70. APPLE, INC.: NET REVENUE, 2020-2022 ($MILLION)
- FIGURE 71. APPLE, INC.: RESEARCH & DEVELOPMENT EXPENDITURE, 2020-2022 ($MILLION)
- FIGURE 72. APPLE, INC.: REVENUE SHARE BY SEGMENT, 2022 (%)
- FIGURE 73. APPLE, INC.: REVENUE SHARE BY REGION, 2022 (%)
- FIGURE 74. AT&T INC.: NET SALES, 2019-2021 ($MILLION)
- FIGURE 75. AT&T INC.: REVENUE SHARE BY SEGMENT, 2021 (%)
- FIGURE 76. AT&T INC.: REVENUE SHARE BY REGION, 2021 (%)
- FIGURE 77. AIRTEL INDIA.: NET REVENUE, 2020-2022 ($MILLION)
- FIGURE 78. AIRTEL INDIA.: REVENUE SHARE BY REGION, 2022 (%)
- FIGURE 79. AIRTEL INDIA.: REVENUE SHARE BY SEGMENT, 2022 (%)
- FIGURE 80. CISCO SYSTEMS, INC.: NET REVENUE, 2020-2022 ($MILLION)
- FIGURE 81. CISCO SYSTEMS, INC.: RESEARCH & DEVELOPMENT EXPENDITURE, 2020-2022 ($MILLION)
- FIGURE 82. CISCO SYSTEMS, INC.: REVENUE SHARE BY SEGMENT, 2022 (%)
- FIGURE 83. GOOGLE LLC: NET REVENUE, 2020-2022 ($MILLION)
- FIGURE 84. IBM CORPORATION: NET REVENUE, 2020-2022 ($MILLION)
- FIGURE 85. IBM CORPORATION: RESEARCH & DEVELOPMENT EXPENDITURE, 2019-2021
- FIGURE 86. IBM CORPORATION: REVENUE SHARE BY REGION, 2022 (%)
- FIGURE 87. IBM CORPORATION: REVENUE SHARE BY SEGMENT, 2022 (%)
- FIGURE 88. MICROSOFT CORPORATION: NET REVENUE, 2020-2022 ($MILLION)
- FIGURE 89. MICROSOFT CORPORATION: RESEARCH & DEVELOPMENT EXPENDITURE, 2020-2022 ($MILLION)
- FIGURE 90. MICROSOFT CORPORATION: REVENUE SHARE BY SEGMENT, 2022 (%)
- FIGURE 91. MICROSOFT CORPORATION: REVENUE SHARE BY REGION, 2022 (%)
- FIGURE 92. ORACLE CORPORATION.: NET REVENUE, 2020-2022 ($MILLION)
- FIGURE 93. ORACLE CORPORATION.: RESEARCH & DEVELOPMENT EXPENDITURE, 2020-2022 ($MILLION)
- FIGURE 94. ORACLE CORPORATION.: REVENUE SHARE BY SEGMENT, 2022 (%)
- FIGURE 95. ORACLE CORPORATION.: REVENUE SHARE BY REGION, 2022 (%)
- FIGURE 96. QUALCOMM TECHNOLOGIES, INC. : NET REVENUE, 2020-2022 ($MILLION)
- FIGURE 97. QUALCOMM TECHNOLOGIES, INC. : RESEARCH & DEVELOPMENT EXPENDITURE, 2020-2022 ($MILLION)
- FIGURE 98. QUALCOMM TECHNOLOGIES, INC. : REVENUE SHARE BY SEGMENT, 2022 (%)
- FIGURE 99. QUALCOMM TECHNOLOGIES, INC. : REVENUE SHARE BY REGION, 2022 (%)
A location-based service (LBS) is a software solution that determines the precise location of a mobile or wireless device. Moreover, these services are utilized for navigation and object, person, and vehicle monitoring, as well as location-based marketing. A smartphone's real-time geo-data points can also be accessed by an LBS to obtain information, entertainment, or security data for later processing.
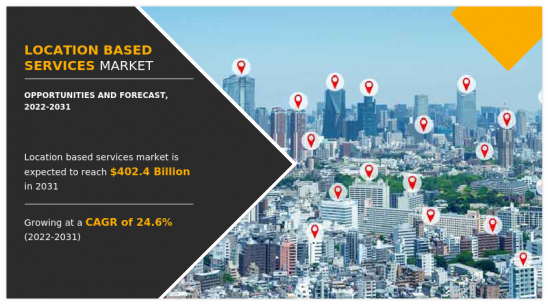
Increase in adoption of social media, smart phones, and easy availability of GPS and emergence of location-based technology is boosting the growth of the global location-based services market. In addition, the increase in number of smartphone users and internet accessibility is positively impacts growth of the location-based services market. However, high cost of installation and maintenance and operational challenges is hampering the location-based services market growth. On the contrary, the growing penetration of 3G and 4G networks and continuous increase in the number of internet users is expected to offer remunerative opportunities for expansion of the location-based services market during the forecast period.
The location-based services market is segmented on the basis of component, technology, application, industry vertical, and region. By component, it is categorized into hardware, software, and services. By technology, it is divided into GPS, Assisted GPS (A-GPS), Enhanced GPS (E-GPS), enhanced observed time difference, observed time difference, cell ID, Wi-Fi, and others. By application, the LBS market is classified into location-based advertising, business intelligence & analytics, fleet management, mapping and navigation, local search & information, social networking & entertainment, proximity marketing, asset tracking, and others.
By industry vertical, it is segmented into transportation & logistics, manufacturing, government & public utilities, retail, healthcare & life sciences, media & entertainment, IT & telecom, BFSI, hospitality, and others. Region-wise, the market is performed across North America, Europe, Asia-Pacific, and LAMEA.
The key players that operate in the location-based services market are: ALE International, Apple, Inc., AT&T Inc., Airtel India., Cisco Systems, Inc., Google Inc., HERE, IBM Corporation, Microsoft Corporation, Oracle Corporation, and Qualcomm Technologies Inc. These players have adopted various strategies to increase their market penetration and strengthen their position in the industry.
Key Benefits For Stakeholders
- The study provides an in-depth analysis of the global location-based services market forecast along with the current and future trends to explain the imminent investment pockets.
- Information about key drivers, restraints, and opportunities and their impact analysis on global location-based services market trend is provided in the report.
- The Porter's five forces analysis illustrates the potency of the buyers and suppliers operating in the industry.
- The quantitative analysis of the market from 2022 to 2031 is provided to determine the market potential.
Key Market Segments
By Component
- Hardware
- Software
- Services
By Technology
- GPS
- Assisted GPS (A-GPS)
- Enhanced GPS (E-GPS)
- Enhanced Observed Time Difference
- Observed Time Difference
- Cell ID
- Wi-Fi
- Others
By Application
- Social Networking and Entertainment
- Proximity Marketing
- Asset Tracking
- Others
- Mapping and Navigation
- Business Intelligence and Analytics
- Fleet Management
- Location-based Advertising
- Local Search and Information
By Industry Vertical
- Transportation and Logistics
- Manufacturing
- Government and Public Utilities
- Retail
- Healthcare and Life Sciences
- Media and Entertainment
- IT and Telecom
- BFSI
- Hospitality
- Others
By Region
- North America
- U.S.
- Canada
- Mexico
- Europe
- UK
- Germany
- France
- Spain
- Italy
- Rest of Europe
- Asia-Pacific
- China
- Japan
- India
- Singapore
- South Korea
- Rest of Asia-Pacific
- LAMEA
- Latin America
- Middle East
- Africa
Key Market Players:
- Apple, Inc.
- Airtel India.
- Cisco Systems, Inc.
- IBM Corporation
- Microsoft Corporation
- Oracle Corporation
- ALE International
- AT&T Inc.
- Google LLC
- HERE
- Qualcomm Technologies, Inc.
TABLE OF CONTENTS
CHAPTER 1: INTRODUCTION
- 1.1. Report description
- 1.2. Key market segments
- 1.3. Key benefits to the stakeholders
- 1.4. Research Methodology
- 1.4.1. Primary research
- 1.4.2. Secondary research
- 1.4.3. Analyst tools and models
CHAPTER 2: EXECUTIVE SUMMARY
- 2.1. CXO Perspective
CHAPTER 3: MARKET OVERVIEW
- 3.1. Market definition and scope
- 3.2. Key findings
- 3.2.1. Top impacting factors
- 3.2.2. Top investment pockets
- 3.3. Porter's five forces analysis
- 3.3.1. Bargaining power of suppliers
- 3.3.2. Bargaining power of buyers
- 3.3.3. Threat of substitutes
- 3.3.4. Threat of new entrants
- 3.3.5. Intensity of rivalry
- 3.4. Market dynamics
- 3.4.1. Drivers
- 3.4.1.1. Increase in adoption of social media, & smart phones, and easy availability of GPS.
- 3.4.1.2. Emergence of location-based technology
- 3.4.1.3. The increase in number of smartphone users and internet accessibility.
- 3.4.1. Drivers
- 3.4.2. Restraints
- 3.4.2.1. High cost of installation and maintenance
- 3.4.2.2. Operational challenges
- 3.4.3. Opportunities
- 3.4.3.1. The growing penetration of 3G & 4G networks and continuous increase in the number of internet users.
- 3.5. COVID-19 Impact Analysis on the market
CHAPTER 4: LOCATION BASED SERVICES MARKET, BY COMPONENT
- 4.1. Overview
- 4.1.1. Market size and forecast
- 4.2. Hardware
- 4.2.1. Key market trends, growth factors and opportunities
- 4.2.2. Market size and forecast, by region
- 4.2.3. Market share analysis by country
- 4.3. Software
- 4.3.1. Key market trends, growth factors and opportunities
- 4.3.2. Market size and forecast, by region
- 4.3.3. Market share analysis by country
- 4.4. Services
- 4.4.1. Key market trends, growth factors and opportunities
- 4.4.2. Market size and forecast, by region
- 4.4.3. Market share analysis by country
CHAPTER 5: LOCATION BASED SERVICES MARKET, BY TECHNOLOGY
- 5.1. Overview
- 5.1.1. Market size and forecast
- 5.2. GPS
- 5.2.1. Key market trends, growth factors and opportunities
- 5.2.2. Market size and forecast, by region
- 5.2.3. Market share analysis by country
- 5.3. Assisted GPS (A-GPS)
- 5.3.1. Key market trends, growth factors and opportunities
- 5.3.2. Market size and forecast, by region
- 5.3.3. Market share analysis by country
- 5.4. Enhanced GPS (E-GPS)
- 5.4.1. Key market trends, growth factors and opportunities
- 5.4.2. Market size and forecast, by region
- 5.4.3. Market share analysis by country
- 5.5. Enhanced Observed Time Difference
- 5.5.1. Key market trends, growth factors and opportunities
- 5.5.2. Market size and forecast, by region
- 5.5.3. Market share analysis by country
- 5.6. Observed Time Difference
- 5.6.1. Key market trends, growth factors and opportunities
- 5.6.2. Market size and forecast, by region
- 5.6.3. Market share analysis by country
- 5.7. Cell ID
- 5.7.1. Key market trends, growth factors and opportunities
- 5.7.2. Market size and forecast, by region
- 5.7.3. Market share analysis by country
- 5.8. Wi-Fi
- 5.8.1. Key market trends, growth factors and opportunities
- 5.8.2. Market size and forecast, by region
- 5.8.3. Market share analysis by country
- 5.9. Others
- 5.9.1. Key market trends, growth factors and opportunities
- 5.9.2. Market size and forecast, by region
- 5.9.3. Market share analysis by country
CHAPTER 6: LOCATION BASED SERVICES MARKET, BY APPLICATION
- 6.1. Overview
- 6.1.1. Market size and forecast
- 6.2. Mapping and Navigation
- 6.2.1. Key market trends, growth factors and opportunities
- 6.2.2. Market size and forecast, by region
- 6.2.3. Market share analysis by country
- 6.3. Business Intelligence and Analytics
- 6.3.1. Key market trends, growth factors and opportunities
- 6.3.2. Market size and forecast, by region
- 6.3.3. Market share analysis by country
- 6.4. Fleet Management
- 6.4.1. Key market trends, growth factors and opportunities
- 6.4.2. Market size and forecast, by region
- 6.4.3. Market share analysis by country
- 6.5. Location-based Advertising
- 6.5.1. Key market trends, growth factors and opportunities
- 6.5.2. Market size and forecast, by region
- 6.5.3. Market share analysis by country
- 6.6. Local Search and Information
- 6.6.1. Key market trends, growth factors and opportunities
- 6.6.2. Market size and forecast, by region
- 6.6.3. Market share analysis by country
- 6.7. Social Networking and Entertainment
- 6.7.1. Key market trends, growth factors and opportunities
- 6.7.2. Market size and forecast, by region
- 6.7.3. Market share analysis by country
- 6.8. Proximity Marketing
- 6.8.1. Key market trends, growth factors and opportunities
- 6.8.2. Market size and forecast, by region
- 6.8.3. Market share analysis by country
- 6.9. Asset Tracking
- 6.9.1. Key market trends, growth factors and opportunities
- 6.9.2. Market size and forecast, by region
- 6.9.3. Market share analysis by country
- 6.10. Others
- 6.10.1. Key market trends, growth factors and opportunities
- 6.10.2. Market size and forecast, by region
- 6.10.3. Market share analysis by country
CHAPTER 7: LOCATION BASED SERVICES MARKET, BY INDUSTRY VERTICAL
- 7.1. Overview
- 7.1.1. Market size and forecast
- 7.2. Transportation and Logistics
- 7.2.1. Key market trends, growth factors and opportunities
- 7.2.2. Market size and forecast, by region
- 7.2.3. Market share analysis by country
- 7.3. Manufacturing
- 7.3.1. Key market trends, growth factors and opportunities
- 7.3.2. Market size and forecast, by region
- 7.3.3. Market share analysis by country
- 7.4. Government and Public Utilities
- 7.4.1. Key market trends, growth factors and opportunities
- 7.4.2. Market size and forecast, by region
- 7.4.3. Market share analysis by country
- 7.5. Retail
- 7.5.1. Key market trends, growth factors and opportunities
- 7.5.2. Market size and forecast, by region
- 7.5.3. Market share analysis by country
- 7.6. Healthcare and Life Sciences
- 7.6.1. Key market trends, growth factors and opportunities
- 7.6.2. Market size and forecast, by region
- 7.6.3. Market share analysis by country
- 7.7. Media and Entertainment
- 7.7.1. Key market trends, growth factors and opportunities
- 7.7.2. Market size and forecast, by region
- 7.7.3. Market share analysis by country
- 7.8. IT and Telecom
- 7.8.1. Key market trends, growth factors and opportunities
- 7.8.2. Market size and forecast, by region
- 7.8.3. Market share analysis by country
- 7.9. BFSI
- 7.9.1. Key market trends, growth factors and opportunities
- 7.9.2. Market size and forecast, by region
- 7.9.3. Market share analysis by country
- 7.10. Hospitality
- 7.10.1. Key market trends, growth factors and opportunities
- 7.10.2. Market size and forecast, by region
- 7.10.3. Market share analysis by country
- 7.11. Others
- 7.11.1. Key market trends, growth factors and opportunities
- 7.11.2. Market size and forecast, by region
- 7.11.3. Market share analysis by country
CHAPTER 8: LOCATION BASED SERVICES MARKET, BY REGION
- 8.1. Overview
- 8.1.1. Market size and forecast By Region
- 8.2. North America
- 8.2.1. Key trends and opportunities
- 8.2.2. Market size and forecast, by Component
- 8.2.3. Market size and forecast, by Technology
- 8.2.4. Market size and forecast, by Application
- 8.2.5. Market size and forecast, by Industry Vertical
- 8.2.6. Market size and forecast, by country
- 8.2.6.1. U.S.
- 8.2.6.1.1. Key market trends, growth factors and opportunities
- 8.2.6.1.2. Market size and forecast, by Component
- 8.2.6.1.3. Market size and forecast, by Technology
- 8.2.6.1.4. Market size and forecast, by Application
- 8.2.6.1.5. Market size and forecast, by Industry Vertical
- 8.2.6.2. Canada
- 8.2.6.2.1. Key market trends, growth factors and opportunities
- 8.2.6.2.2. Market size and forecast, by Component
- 8.2.6.2.3. Market size and forecast, by Technology
- 8.2.6.2.4. Market size and forecast, by Application
- 8.2.6.2.5. Market size and forecast, by Industry Vertical
- 8.2.6.3. Mexico
- 8.2.6.3.1. Key market trends, growth factors and opportunities
- 8.2.6.3.2. Market size and forecast, by Component
- 8.2.6.3.3. Market size and forecast, by Technology
- 8.2.6.3.4. Market size and forecast, by Application
- 8.2.6.3.5. Market size and forecast, by Industry Vertical
- 8.3. Europe
- 8.3.1. Key trends and opportunities
- 8.3.2. Market size and forecast, by Component
- 8.3.3. Market size and forecast, by Technology
- 8.3.4. Market size and forecast, by Application
- 8.3.5. Market size and forecast, by Industry Vertical
- 8.3.6. Market size and forecast, by country
- 8.3.6.1. UK
- 8.3.6.1.1. Key market trends, growth factors and opportunities
- 8.3.6.1.2. Market size and forecast, by Component
- 8.3.6.1.3. Market size and forecast, by Technology
- 8.3.6.1.4. Market size and forecast, by Application
- 8.3.6.1.5. Market size and forecast, by Industry Vertical
- 8.3.6.2. Germany
- 8.3.6.2.1. Key market trends, growth factors and opportunities
- 8.3.6.2.2. Market size and forecast, by Component
- 8.3.6.2.3. Market size and forecast, by Technology
- 8.3.6.2.4. Market size and forecast, by Application
- 8.3.6.2.5. Market size and forecast, by Industry Vertical
- 8.3.6.3. France
- 8.3.6.3.1. Key market trends, growth factors and opportunities
- 8.3.6.3.2. Market size and forecast, by Component
- 8.3.6.3.3. Market size and forecast, by Technology
- 8.3.6.3.4. Market size and forecast, by Application
- 8.3.6.3.5. Market size and forecast, by Industry Vertical
- 8.3.6.4. Spain
- 8.3.6.4.1. Key market trends, growth factors and opportunities
- 8.3.6.4.2. Market size and forecast, by Component
- 8.3.6.4.3. Market size and forecast, by Technology
- 8.3.6.4.4. Market size and forecast, by Application
- 8.3.6.4.5. Market size and forecast, by Industry Vertical
- 8.3.6.5. Italy
- 8.3.6.5.1. Key market trends, growth factors and opportunities
- 8.3.6.5.2. Market size and forecast, by Component
- 8.3.6.5.3. Market size and forecast, by Technology
- 8.3.6.5.4. Market size and forecast, by Application
- 8.3.6.5.5. Market size and forecast, by Industry Vertical
- 8.3.6.6. Rest of Europe
- 8.3.6.6.1. Key market trends, growth factors and opportunities
- 8.3.6.6.2. Market size and forecast, by Component
- 8.3.6.6.3. Market size and forecast, by Technology
- 8.3.6.6.4. Market size and forecast, by Application
- 8.3.6.6.5. Market size and forecast, by Industry Vertical
- 8.4. Asia-Pacific
- 8.4.1. Key trends and opportunities
- 8.4.2. Market size and forecast, by Component
- 8.4.3. Market size and forecast, by Technology
- 8.4.4. Market size and forecast, by Application
- 8.4.5. Market size and forecast, by Industry Vertical
- 8.4.6. Market size and forecast, by country
- 8.4.6.1. China
- 8.4.6.1.1. Key market trends, growth factors and opportunities
- 8.4.6.1.2. Market size and forecast, by Component
- 8.4.6.1.3. Market size and forecast, by Technology
- 8.4.6.1.4. Market size and forecast, by Application
- 8.4.6.1.5. Market size and forecast, by Industry Vertical
- 8.4.6.2. Japan
- 8.4.6.2.1. Key market trends, growth factors and opportunities
- 8.4.6.2.2. Market size and forecast, by Component
- 8.4.6.2.3. Market size and forecast, by Technology
- 8.4.6.2.4. Market size and forecast, by Application
- 8.4.6.2.5. Market size and forecast, by Industry Vertical
- 8.4.6.3. India
- 8.4.6.3.1. Key market trends, growth factors and opportunities
- 8.4.6.3.2. Market size and forecast, by Component
- 8.4.6.3.3. Market size and forecast, by Technology
- 8.4.6.3.4. Market size and forecast, by Application
- 8.4.6.3.5. Market size and forecast, by Industry Vertical
- 8.4.6.4. Singapore
- 8.4.6.4.1. Key market trends, growth factors and opportunities
- 8.4.6.4.2. Market size and forecast, by Component
- 8.4.6.4.3. Market size and forecast, by Technology
- 8.4.6.4.4. Market size and forecast, by Application
- 8.4.6.4.5. Market size and forecast, by Industry Vertical
- 8.4.6.5. South Korea
- 8.4.6.5.1. Key market trends, growth factors and opportunities
- 8.4.6.5.2. Market size and forecast, by Component
- 8.4.6.5.3. Market size and forecast, by Technology
- 8.4.6.5.4. Market size and forecast, by Application
- 8.4.6.5.5. Market size and forecast, by Industry Vertical
- 8.4.6.6. Rest of Asia-Pacific
- 8.4.6.6.1. Key market trends, growth factors and opportunities
- 8.4.6.6.2. Market size and forecast, by Component
- 8.4.6.6.3. Market size and forecast, by Technology
- 8.4.6.6.4. Market size and forecast, by Application
- 8.4.6.6.5. Market size and forecast, by Industry Vertical
- 8.5. LAMEA
- 8.5.1. Key trends and opportunities
- 8.5.2. Market size and forecast, by Component
- 8.5.3. Market size and forecast, by Technology
- 8.5.4. Market size and forecast, by Application
- 8.5.5. Market size and forecast, by Industry Vertical
- 8.5.6. Market size and forecast, by country
- 8.5.6.1. Latin America
- 8.5.6.1.1. Key market trends, growth factors and opportunities
- 8.5.6.1.2. Market size and forecast, by Component
- 8.5.6.1.3. Market size and forecast, by Technology
- 8.5.6.1.4. Market size and forecast, by Application
- 8.5.6.1.5. Market size and forecast, by Industry Vertical
- 8.5.6.2. Middle East
- 8.5.6.2.1. Key market trends, growth factors and opportunities
- 8.5.6.2.2. Market size and forecast, by Component
- 8.5.6.2.3. Market size and forecast, by Technology
- 8.5.6.2.4. Market size and forecast, by Application
- 8.5.6.2.5. Market size and forecast, by Industry Vertical
- 8.5.6.3. Africa
- 8.5.6.3.1. Key market trends, growth factors and opportunities
- 8.5.6.3.2. Market size and forecast, by Component
- 8.5.6.3.3. Market size and forecast, by Technology
- 8.5.6.3.4. Market size and forecast, by Application
- 8.5.6.3.5. Market size and forecast, by Industry Vertical
CHAPTER 9: COMPETITIVE LANDSCAPE
- 9.1. Introduction
- 9.2. Top winning strategies
- 9.3. Product Mapping of Top 10 Player
- 9.4. Competitive Dashboard
- 9.5. Competitive Heatmap
- 9.6. Top player positioning, 2021
CHAPTER 10: COMPANY PROFILES
- 10.1. ALE International
- 10.1.1. Company overview
- 10.1.2. Key Executives
- 10.1.3. Company snapshot
- 10.1.4. Operating business segments
- 10.1.5. Product portfolio
- 10.1.6. Key strategic moves and developments
- 10.2. Apple, Inc.
- 10.2.1. Company overview
- 10.2.2. Key Executives
- 10.2.3. Company snapshot
- 10.2.4. Operating business segments
- 10.2.5. Product portfolio
- 10.2.6. Business performance
- 10.2.7. Key strategic moves and developments
- 10.3. AT&T Inc.
- 10.3.1. Company overview
- 10.3.2. Key Executives
- 10.3.3. Company snapshot
- 10.3.4. Operating business segments
- 10.3.5. Product portfolio
- 10.3.6. Business performance
- 10.3.7. Key strategic moves and developments
- 10.4. Airtel India.
- 10.4.1. Company overview
- 10.4.2. Key Executives
- 10.4.3. Company snapshot
- 10.4.4. Operating business segments
- 10.4.5. Product portfolio
- 10.4.6. Business performance
- 10.4.7. Key strategic moves and developments
- 10.5. Cisco Systems, Inc.
- 10.5.1. Company overview
- 10.5.2. Key Executives
- 10.5.3. Company snapshot
- 10.5.4. Operating business segments
- 10.5.5. Product portfolio
- 10.5.6. Business performance
- 10.5.7. Key strategic moves and developments
- 10.6. Google LLC
- 10.6.1. Company overview
- 10.6.2. Key Executives
- 10.6.3. Company snapshot
- 10.6.4. Operating business segments
- 10.6.5. Product portfolio
- 10.6.6. Business performance
- 10.6.7. Key strategic moves and developments
- 10.7. HERE
- 10.7.1. Company overview
- 10.7.2. Key Executives
- 10.7.3. Company snapshot
- 10.7.4. Operating business segments
- 10.7.5. Product portfolio
- 10.7.6. Key strategic moves and developments
- 10.8. IBM Corporation
- 10.8.1. Company overview
- 10.8.2. Key Executives
- 10.8.3. Company snapshot
- 10.8.4. Operating business segments
- 10.8.5. Product portfolio
- 10.8.6. Business performance
- 10.8.7. Key strategic moves and developments
- 10.9. Microsoft Corporation
- 10.9.1. Company overview
- 10.9.2. Key Executives
- 10.9.3. Company snapshot
- 10.9.4. Operating business segments
- 10.9.5. Product portfolio
- 10.9.6. Business performance
- 10.9.7. Key strategic moves and developments
- 10.10. Oracle Corporation
- 10.10.1. Company overview
- 10.10.2. Key Executives
- 10.10.3. Company snapshot
- 10.10.4. Operating business segments
- 10.10.5. Product portfolio
- 10.10.6. Business performance
- 10.10.7. Key strategic moves and developments
- 10.11. Qualcomm Technologies, Inc.
- 10.11.1. Company overview
- 10.11.2. Key Executives
- 10.11.3. Company snapshot
- 10.11.4. Operating business segments
- 10.11.5. Product portfolio
- 10.11.6. Business performance
- 10.11.7. Key strategic moves and developments