|
|
市場調査レポート
商品コード
1123644
建設のインドネシア市場 - 市場規模、動向、予測:セクター別 - 商業、工業、インフラ、エネルギー・ユーティリティ、施設、住宅(2022年~2026年)Indonesia Construction Market Size, Trends and Forecasts by Sector - Commercial, Industrial, Infrastructure, Energy and Utilities, Institutional and Residential Market Analysis, 2022-2026 |
||||||
|
|
|||||||
|
● お客様のご希望に応じて、既存データの加工や未掲載情報(例:国別セグメント)の追加などの対応が可能です。 詳細はお問い合わせください。 |
|||||||


| 建設のインドネシア市場 - 市場規模、動向、予測:セクター別 - 商業、工業、インフラ、エネルギー・ユーティリティ、施設、住宅(2022年~2026年) |
|
出版日: 2022年11月17日
発行: GlobalData
ページ情報: 英文 50 Pages
納期: 即納可能
|
- 全表示
- 概要
- 図表
- 目次
インドネシアの建設の市場規模は、2022年は実質5.8%の成長が見込まれており、2023年から2026年の予測期間中には5.8%の年平均成長率が予想されています。市場の成長を後押しする主な要因には、輸送、電力、住宅、製造プロジェクトに対する投資、国家中期開発計画(RPJMN)および電力調達計画(RUPTL)の一環としての投資などが挙げられます。
当レポートでは、インドネシアの建設市場を調査しており、概要、市場の見通し、セクター別の分析など、包括的な情報を提供しています。
目次
目次
第1章 エグゼクティブサマリー
第2章 建設業界:概要
第3章 コンテキスト
- 経済的実績
- 政治環境と政策
- 人口統計
- COVID-19の状況
- リスクプロファイル
第4章 建設の見通し
- すべての建設
- 見通し
- 最新のニュースと開発
- 建設プロジェクトモメンタムインデックス
- 商業建設
- 見通し
- プロジェクト分析
- 最新のニュースと開発
- 工業建設
- 見通し
- プロジェクト分析
- 最新のニュースと開発
- インフラ建設
- 見通し
- プロジェクト分析
- 最新のニュースと開発
- エネルギー・ユーティリティ建設
- 見通し
- プロジェクト分析
- 最新のニュースと開発
- 施設建設
- 見通し
- プロジェクト分析
- 最新のニュースと開発
- 住宅建設
- 見通し
- プロジェクト分析
- 最新のニュースと開発
第5章 主要な業界参加者
- 請負業者
- コンサルタント
第6章 建設市場データ
第7章 付録
List of Tables
List of Tables
- Table 1: Construction Industry Key Data
- Table 2: Indonesia, Key Economic Indicators
- Table 3: Indonesia, Commercial Construction Output by Project Type (Real % Change), 2017-26
- Table 4: Indonesia, Top Commercial Construction Projects by Value
- Table 5: Indonesia, Industrial Construction Output by Project Type (Real % Change), 2017-26
- Table 6: Indonesia, Top Industrial Construction Projects by Value
- Table 7: Indonesia, Infrastructure Construction Output by Project Type (Real % Change), 2017-26
- Table 8: Indonesia, Top Infrastructure Construction Projects by Value
- Table 9: Indonesia, Energy and Utilities Construction Output by Project Type (Real % Change), 2017-26
- Table 10: Indonesia, Top Energy and Utilities Construction Projects by Value
- Table 11: Indonesia, Institutional Construction Output by Project Type (Real % Change), 2017-26
- Table 12: Indonesia, Top Institutional Construction Projects by Value
- Table 13: Indonesia, Residential Construction Output by Project Type (Real % Change), 2017-26
- Table 14: Indonesia, Top Residential Construction Projects by Value
- Table 15: Indonesia, Key Contractors
- Table 16: Indonesia, Key Consultants
- Table 17: Indonesia, Construction Output Value (Real, $ Million)
- Table 18: Indonesia, Construction Output Value (Nominal, IDR Trillion)
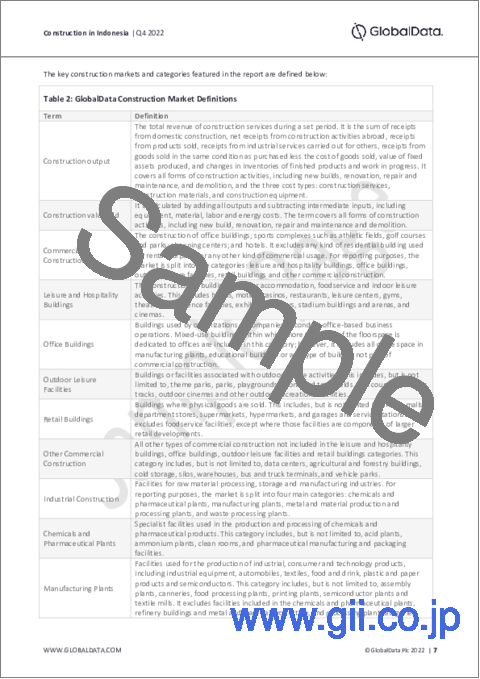
- Table 19: GlobalData Construction Market Definitions
- Table 20: Risk Dimensions
- Table 21: Ratings, Scores, and Definitions
List of Figures
List of Figures
- Figure 1: South-East Asia, Construction Output (Real % Change), 2020-26
- Figure 2: Indonesia, Construction Output by Sector (Real % Change), 2020-22 and 2023-26
- Figure 3: Indonesia, COVID-19 Confirmed Cases
- Figure 4: Indonesia, Risk Summary
- Figure 5: Indonesia, Risk Regional Comparison
- Figure 6: Indonesia, Construction Output Value (Real, $ Billion, 2017 Prices and Exchange Rate), 2017-26
- Figure 7: Indonesia, Construction Output Value, by Sector (Real, $ Million), 2017-26
- Figure 8: Indonesia, Construction Value Add, 2010 Constant Prices, in IDR Trillion
- Figure 9: Indonesia, Value Index of Construction Completed by Construction Companies (2016 = 100)
- Figure 10: Indonesia, Permanent Construction Worker Index (2016=100)
- Figure 11: Indonesia, Construction Projects Momentum Index
- Figure 12: Region, Construction Projects Momentum Index
- Figure 13: Indonesia, Commercial Construction Output by Project Type (Real, $ Million), 2017-26
- Figure 14: Indonesia, Commercial Construction Projects Pipeline, Value by Stage ($ Million)
- Figure 15: Indonesia, Accommodation and Food Services Value Add, 2010 Constant Prices, in IDR Trillion
- Figure 16: Indonesia, Wholesale and Retail Trade Value Add, 2010 Constant Prices, in IDR Trillion
- Figure 17: Indonesia, Real Retail Sales Index (2010=100)
- Figure 18: Indonesia, Commercial Property Demand Index for Office and Hotel Buildings (2017=100)
- Figure 19: Indonesia, Number of Foreign Tourist Visits (in Thousands)
- Figure 20: Indonesia, Industrial Construction Output by Project Type (Real, $ Million), 2017-26
- Figure 21: Indonesia, Industrial Construction Projects Pipeline, Value by Stage ($ Million)
- Figure 22: Indonesia, Manufacturing Value Add, 2010 Constant Prices, in IDR Trillion
- Figure 23: Indonesia, Total Value of Exports ($ Billion)
- Figure 24: Indonesia, Bank Indonesia Prompt Manufacturing Index (PMI-BI)
- Figure 25: Indonesia, Infrastructure Construction Output by Project Type (Real, $ Million), 2017-26
- Figure 26: Indonesia, Infrastructure Construction Projects Pipeline, Value by Stage ($ Million)
- Figure 27: Indonesia, Energy and Utilities Construction Output by Project Type (Real, $ Million), 2017-26
- Figure 28: Indonesia, Energy and Utilities Construction Projects Pipeline, Value by Stage ($ Million)
- Figure 29: Indonesia, Total Oil and Gas Exports ($ Million)
- Figure 30: Indonesia, Institutional Construction Output by Project Type (Real, $ Million), 2017-26
- Figure 31: Indonesia, Institutional Construction Projects Pipeline, Value by Stage ($ Million)
- Figure 32: Indonesia, Education Sector Value Add (IDR Trillion, 2010 Constant Prices)
- Figure 33: Indonesia, Residential Construction Output by Project Type (Real, $ Million), 2017-26
- Figure 34: Indonesia, Residential Construction Projects Pipeline, Value by Stage ($ Million)
- Figure 35: Indonesia, Real-Estate Value Add (IDR Trillion, 2010 Constant Prices)
- Figure 36: Indonesia, Residential Property Prices (% Change YoY)
- Figure 37: Indonesia, Headquarters of Key Contractors (% of Total Project Pipeline)
- Figure 38: Indonesia, Headquarters of Key Consultants (% of Total Project Pipeline)
GlobalData has revised down its projection of the growth of the Indonesian construction industry to 2%, from its prior projection of a 5.8% growth, owing to rising construction costs, higher energy prices, increasing inflation, and a tightening of monetary policy, all of which are expected to lead to a 3.6% decline in commercial construction and a 0.9% and 0.3% decline in institutional and residential construction sector respectively in 2022. However, the development of transportation and energy infrastructure projects will drive the growth of the industry's output this year. The government has committed IDR37.3 trillion ($2.6 billion) of investment for the Connectivity Infrastructure Program in the 2022 Budget, which includes IDR20.1 trillion ($1.4 billion) for road and bridge preservation, IDR5.5 trillion ($377.9 million) for road construction, IDR5.3 trillion ($364.2 million) for flyover and underpass construction, and IDR4.8 trillion ($329.8 million) for highway construction, among others. In addition, the total investment in Indonesia increased by 35.3% year on year (YoY) during the first nine months of 2022, totaling IDR892.4 trillion ($61.3 billion) and reaching 74.4% of the 2022 target of IDR1,200 trillion ($82.5 million).
Over the remainder of the forecast period, the Indonesian construction industry is expected to register an annual average growth of 4.9% from 2023 to 2026, supported by investment on transport, electricity, housing, and manufacturing projects. Previously, in 2021, the government announced its plan to relocate Indonesia's capital city away from Jakarta to Nusantara, with an investment of IDR494.8 trillion ($34 billion). Accordingly, with the signing of contracts for 19 project packages totaling IDR5.3 trillion ($364.2 million) in August 2022, the Public Works and Public Housing (PUPR) Ministry launched the first phase of basic infrastructure development of the new capital (IKN) Nusantara, East Kalimantan. Forecast-period growth will also be supported by investment as part of the 2020-24 National Medium-Term Development Plan (RPJMN) and the Electricity Procurement Plan (RUPTL) 2021-30
The report provides detailed market analysis, information and insights into the Indonesian construction industry, including -
- The Indonesian construction industry's growth prospects by market, project type and construction activity
- Critical insight into the impact of industry trends and issues, as well as an analysis of key risks and opportunities in the Indonesian construction industry
- Analysis of the mega-project pipeline, focusing on development stages and participants, in addition to listings of major projects in the pipeline
Scope
This report provides a comprehensive analysis of the construction industry in Indonesia. It provides -
- Historical (2017-2021) and forecast (2022-2026) valuations of the construction industry in Indonesia, featuring details of key growth drivers.
- Segmentation by sector (commercial, industrial, infrastructure, energy and utilities, institutional and residential) and by sub-sector
- Analysis of the mega-project pipeline, including breakdowns by development stage across all sectors, and projected spending on projects in the existing pipeline.
- Listings of major projects, in addition to details of leading contractors and consultants
Reasons to Buy
- Identify and evaluate market opportunities using GlobalData's standardized valuation and forecasting methodologies.
- Assess market growth potential at a micro-level with over 600 time-series data forecasts.
- Understand the latest industry and market trends.
- Formulate and validate strategy using GlobalData's critical and actionable insight.
- Assess business risks, including cost, regulatory and competitive pressures.
- Evaluate competitive risk and success factors.
Table of Contents
Table of Contents
1 Executive Summary
2 Construction Industry: At-a-Glance
3 Context
- 3.1 Economic Performance
- 3.2 Political Environment and Policy
- 3.3 Demographics
- 3.4 COVID-19 Status
- 3.5 Risk Profile
4 Construction Outlook
- 4.1 All Construction
- Outlook
- Latest news and developments
- Construction Projects Momentum Index
- 4.2 Commercial Construction
- Outlook
- Project analytics
- Latest news and developments
- 4.3 Industrial Construction
- Outlook
- Project analytics
- Latest news and developments
- 4.4 Infrastructure Construction
- Outlook
- Project analytics
- Latest news and developments
- 4.5 Energy and Utilities Construction
- Outlook
- Project analytics
- Latest news and developments
- 4.6 Institutional Construction
- Outlook
- Project analytics
- Latest news and developments
- 4.7 Residential Construction
- Outlook
- Project analytics
- Latest news and developments
5 Key Industry Participants
- 5.1 Contractors
- 5.2 Consultants
6 Construction Market Data
7 Appendix
- 7.1 What is this Report About?
- 7.2 Definitions
- 7.3 CRI Methodology
- 7.4 GlobalData Construction
- Contact Us