|
|
市場調査レポート
商品コード
1072803
マルチクッカーの世界市場(2022年~2026年)Global Multicooker Market 2022-2026 |
||||||
|
|
|||||||
|
● お客様のご希望に応じて、既存データの加工や未掲載情報(例:国別セグメント)の追加などの対応が可能です。 詳細はお問い合わせください。 |
|||||||


| マルチクッカーの世界市場(2022年~2026年) |
|
出版日: 2022年04月26日
発行: TechNavio
ページ情報: 英文 120 Pages
納期: 即納可能
|
- 全表示
- 概要
- 図表
- 目次
世界のマルチクッカーの市場規模は、予測期間中に16.45%のCAGRとなり、2022年から2026年の間に13億5,000万米ドルに達すると予測されています。
当レポートでは、世界のマルチクッカー市場を調査し、市場規模・予測、最新動向、成長要因、課題などの情報を提供しています。
目次
第1章 エグゼクティブサマリー
- 市場概要
第2章 市場情勢
- 市場のエコシステム
第3章 市場規模
- 市場定義
- 市場セグメント分析
- 市場規模(2021年)
- 市場の見通し:予測(2021年~2026年)
第4章 ファイブフォース分析
- ファイブフォースの要約
- 買い手の交渉力
- 供給企業の交渉力
- 新規参入業者の脅威
- 代替品の脅威
- ライバルの脅威
- 市況
第5章 市場セグメンテーション:流通チャネル別
- 市場セグメント
- 比較:流通チャネル別
- オフライン - 市場規模と予測(2021年~2026年)
- オンライン - 市場規模と予測(2021年~2026年)
- 市場機会:流通チャネル別
第6章 市場セグメンテーション:容量別
- 市場セグメント
- 比較:容量別
- 5~6クォート - 市場規模と予測(2021年~2026年)
- 5クォート未満 - 市場規模と予測(2021年~2026年)
- 6クォート超 - 市場規模と予測(2021年~2026年)
- 市場機会:容量別
第7章 顧客情勢
- 顧客情勢の概要
第8章 地理的情勢
- 地理的セグメンテーション
- 地理的比較
- 北米 - 市場規模と予測(2021年~2026年)
- 欧州 - 市場規模と予測(2021年~2026年)
- アジア太平洋 - 市場規模と予測(2021年~2026年)
- 南米 - 市場規模と予測(2021年~2026年)
- 中東・アフリカ - 市場規模と予測(2021年~2026年)
- 米国 - 市場規模と予測(2021年~2026年)
- ドイツ - 市場規模と予測(2021年~2026年)
- 中国 - 市場規模と予測(2021年~2026年)
- 英国 - 市場規模と予測(2021年~2026年)
- フランス - 市場規模と予測(2021年~2026年)
- 市場機会:地理的情勢別
第9章 成長要因、課題、動向
- 市場促進要因
- 市場の課題
- 成長要因と課題の影響
- 市場動向
第10章 ベンダー情勢
- 概要
- ベンダー情勢
- 破壊的情勢
- 業界リスク
第11章 ベンダー分析
- 対象ベンダー
- ベンダーの市場ポジショニング
- Corelle Brands LLC
- Glen Dimplex Group
- Groupe SEB
- Hamilton Beach Brands Holding Co.
- Koninklijke Philips NV
- Newell Brands Inc.
- Panasonic Corp.
- REDMOND Industrial group
- Spectrum Brands Holdings Inc.
- Whirlpool Corp.
第12章 付録
- 調査範囲
- 包含・除外チェックリスト
- 米ドルの為替レート
- 調査手法
- 略語のリスト
図表:
- 図表1:エグゼクティブサマリー - 市場概要のチャート
- 図表2:エグゼクティブサマリー - 市場概要のデータ表
- 図表3:エグゼクティブサマリー - 世界市場の特徴に関するチャート
- 図表4:エグゼクティブサマリー - 地理的情勢の市場チャート
- 図表5:エグゼクティブサマリー - 市場セグメンテーションに関するチャート:流通チャネル別
- 図表6:エグゼクティブサマリー - 市場セグメンテーションに関するチャート:容量別
- 図表7:エグゼクティブサマリー - 増分成長に関するチャート
- 図表8:エグゼクティブサマリー - 増分成長に関するデータ表
- 図表9:エグゼクティブサマリー - ベンダーの市場ポジショニングに関するチャート
- 図表10:親市場
- 図表11:市場の特徴
- 図表12:市場定義に含まれるベンダーの提供
- 図表13:市場セグメント
- 図表14:世界のチャート - 市場規模と予測(2021年~2026年)
- 図表15:世界のデータ表 - 市場規模と予測(2021年~2026年)
- 図表16:世界市場のチャート:前年比成長率(%)(2021年~2026年)
- 図表17:世界市場のデータ表:前年比成長率(%)(2021年~2026年)
- 図表18:ファイブフォース分析 - 比較(2021年と2026年)
- 図表19:買い手の交渉力に関するチャート - 主要な要因の影響(2021年と2026年)
- 図表20:供給企業の交渉力 - 主要な要因の影響(2021年と2026年)
- 図表21:新規参入業者の脅威 - 主要な要因の影響(2021年と2026年)
- 図表22:代替品の脅威 - 主要な要因の影響(2021年と2026年)
- 図表23:ライバルの脅威 - 主要な要因の影響(2021年と2026年)
- 図表24:市況のチャート - ファイブフォース(2021年と2026年)
- 図表25:流通チャネルのチャート - 市場シェア(%)(2021年~2026年)
- 図表26:流通チャネルのデータ表 - 市場シェア(%)(2021年~2026年)
- 図表27:比較のチャート:流通チャネル別
- 図表28:比較のデータ表:流通チャネル別
- 図表29:オフラインのチャート - 市場規模と予測(2021年~2026年)
- 図表30:オフラインのデータ表 - 市場規模と予測(2021年~2026年)
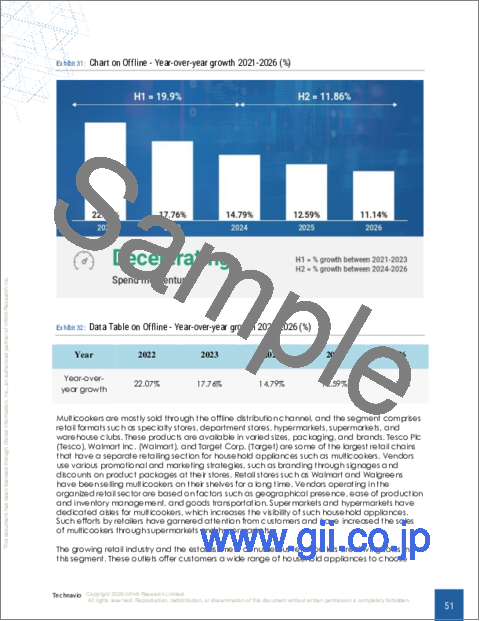
- 図表31:オフラインのチャート - 前年比成長率(%)(2021年~2026年)
- 図表32:オフラインのデータ表 - 前年比成長率(%)(2021年~2026年)
- 図表33:オフラインのチャート - 市場規模と予測(2021年~2026年)
- 図表34:オンラインのデータ表 - 市場規模と予測(2021年~2026年)
- 図表35:オフラインのチャート - 前年比成長率(%)(2021年~2026年)
- 図表36:オンラインのデータ表 - 前年比成長率(%)(2021年~2026年)
- 図表37:市場機会:流通チャネル別
- 図表38:容量のチャート - 市場シェア(%)(2021年~2026年)
- 図表39:容量のデータ表 - 市場シェア(%)(2021年~2026年)
- 図表40:比較のチャート:容量別
- 図表41:比較のデータ表:容量別
- 図表42:5~6クォートのチャート - 市場規模と予測(2021年~2026年)
- 図表43:5~6クォートのデータ表 - 市場規模と予測(2021年~2026年)
- 図表44:5~6クォートのチャート - 前年比成長率(%)(2021年~2026年)
- 図表45:5~6クォートのデータ表 - 前年比成長率(%)(2021年~2026年)
- 図表46:5クォート未満のチャート - 市場規模と予測(2021年~2026年)
- 図表47:5クォート未満のデータ表 - 市場規模と予測(2021年~2026年)
- 図表48:5クォート未満のチャート - 前年比成長率(%)(2021年~2026年)
- 図表49:5クォート未満のデータ表 - 前年比成長率(%)(2021年~2026年)
- 図表50:6クォート超のチャート - 市場規模と予測(2021年~2026年)
- 図表51:6クォート超のデータ表 - 市場規模と予測(2021年~2026年)
- 図表52:6クォート超のチャート - 前年比成長率(%)(2021年~2026年)
- 図表53:6クォート超のデータ表 - 前年比成長率(%)(2021年~2026年)
- 図表54:市場機会:容量別
- 図表55:価格感応度、ライフサイクル、顧客購入バスケット、採用率、購入基準の分析
- 図表56:市場シェアのチャート:地理的情勢別(%)(2021年~2026年)
- 図表57:市場シェアのデータ表:地理的情勢別(%)(2021年~2026年)
- 図表58:地理的比較のチャート
- 図表59:地理的比較のデータ表
- 図表60:北米のチャート - 市場規模と予測(2021年~2026年)
- 図表61:北米のデータ表 - 市場規模と予測(2021年~2026年)
- 図表62:北米のチャート - 前年比成長率(%)(2021年~2026年)
- 図表63:北米のデータ表 - 前年比成長率(%)(2021年~2026年)
- 図表64:欧州のチャート - 市場規模と予測(2021年~2026年)
- 図表65:欧州のデータ表 - 市場規模と予測(2021年~2026年)
- 図表66:欧州のチャート - 前年比成長率(%)(2021年~2026年)
- 図表67:欧州のデータ表 - 前年比成長率(%)(2021年~2026年)
- 図表68:アジア太平洋のチャート - 市場規模と予測(2021年~2026年)
- 図表69:アジア太平洋のデータ表 - 市場規模と予測(2021年~2026年)
- 図表70:アジア太平洋のチャート - 前年比成長率(%)(2021年~2026年)
- 図表71:アジア太平洋のデータ表 - 前年比成長率(%)(2021年~2026年)
- 図表72:南米のチャート - 市場規模と予測(2021年~2026年)
- 図表73:南米のデータ表 - 市場規模と予測(2021年~2026年)
- 図表74:南米のチャート - 前年比成長率(%)(2021年~2026年)
- 図表75:南米のデータ表 - 前年比成長率(%)(2021年~2026年)
- 図表76:中東・アフリカのチャート - 市場規模と予測(2021年~2026年)
- 図表77:中東・アフリカのデータ表 - 市場規模と予測(2021年~2026年)
- 図表78:中東・アフリカのチャート - 前年比成長率(%)(2021年~2026年)
- 図表79:中東・アフリカのデータ表 - 前年比成長率(%)(2021年~2026年)
- 図表80:米国のチャート - 市場規模と予測(2021年~2026年)
- 図表81:米国のデータ表 - 市場規模と予測(2021年~2026年)
- 図表82:米国のチャート - 前年比成長率(%)(2021年~2026年)
- 図表83:米国のデータ表 - 前年比成長率(%)(2021年~2026年)
- 図表84:ドイツのチャート - 市場規模と予測(2021年~2026年)
- 図表85:ドイツのデータ表 - 市場規模と予測(2021年~2026年)
- 図表86:ドイツのチャート - 前年比成長率(%)(2021年~2026年)
- 図表87:ドイツのデータ表 - 前年比成長率(%)(2021年~2026年)
- 図表88:中国のチャート - 市場規模と予測(2021年~2026年)
- 図表89:中国のデータ表 - 市場規模と予測(2021年~2026年)
- 図表90:中国のチャート - 前年比成長率(%)(2021年~2026年)
- 図表91:中国のデータ表 - 前年比成長率(%)(2021年~2026年)
- 図表92:英国のチャート - 市場規模と予測(2021年~2026年)
- 図表93:英国のデータ表 - 市場規模と予測(2021年~2026年)
- 図表94:英国のチャート - 前年比成長率(%)(2021年~2026年)
- 図表95:英国のデータ表 - 前年比成長率(%)(2021年~2026年)
- 図表96:フランスのチャート - 市場規模と予測(2021年~2026年)
- 図表97:フランスのデータ表 - 市場規模と予測(2021年~2026年)
- 図表98:フランスのチャート - 前年比成長率(%)(2021年~2026年)
- 図表99:フランスのデータ表 - 前年比成長率(%)(2021年~2026年)
- 図表100:市場機会:地理的情勢別
- 図表101:成長要因と課題の影響(2021年と2026年)
- 図表102:インプットの重要性と差別化の要因に関する概要
- 図表103:混乱の要因の概要
- 図表104:主要リスクがビジネスに与える影響
- 図表105:対象ベンダー
- 図表106:ベンダーポジションと分類に関するマトリックス
- 図表107:Corelle Brands LLC - 概要
- 図表108:Corelle Brands LLC - 製品/サービス
- 図表109:Corelle Brands LLC - 主な製品
- 図表110:Glen Dimplex Group - 概要
- 図表111:Glen Dimplex Group - 製品/サービス
- 図表112:Glen Dimplex Group - 主な製品
- 図表113:Groupe SEB - 概要
- 図表114:Groupe SEB - 事業セグメント
- 図表115:Groupe SEB - 重要なニュース
- 図表116:Groupe SEB - 主な製品
- 図表117:Groupe SEB - セグメントフォーカス
- 図表118:Hamilton Beach Brands Holding Co. - 概要
- 図表119:Hamilton Beach Brands Holding Co. - 製品/サービス
- 図表120:Hamilton Beach Brands Holding Co. - 重要なニュース
- 図表121:Hamilton Beach Brands Holding Co. - 主な製品
- 図表122:Koninklijke Philips NV - 概要
- 図表123:Koninklijke Philips NV - 事業セグメント
- 図表124:Koninklijke Philips NV - 重要なニュース
- 図表125:Koninklijke Philips NV - 主な製品
- 図表126:Koninklijke Philips NV - セグメントフォーカス
- 図表127:Newell Brands Inc. - 概要
- 図表128:Newell Brands Inc. - 事業セグメント
- 図表129:Newell Brands Inc. - 重要なニュース
- 図表130:Newell Brands Inc. - 主な製品
- 図表131:Newell Brands Inc. - セグメントフォーカス
- 図表132:Panasonic Corp. - 概要
- 図表133:Panasonic Corp. - 事業セグメント
- 図表134:Panasonic Corp. - 主な製品
- 図表135:Panasonic Corp. - セグメントフォーカス
- 図表136:REDMOND Industrial group - 概要
- 図表137:REDMOND Industrial group - 製品/サービス
- 図表138:REDMOND Industrial group - 主な製品
- 図表139:Spectrum Brands Holdings Inc. - 概要
- 図表140:Spectrum Brands Holdings Inc. - 事業セグメント
- 図表141:Spectrum Brands Holdings Inc. - 重要なニュース
- 図表142:Spectrum Brands Holdings Inc. - 主な製品
- 図表143:Spectrum Brands Holdings Inc. - セグメントフォーカス
- 図表144:Whirlpool Corp. - 概要
- 図表145:Whirlpool Corp. - 事業セグメント
- 図表146:Whirlpool Corp. - 主な製品
- 図表147:Whirlpool Corp. - セグメントフォーカス
- 図表148:包含チェックリスト
- 図表149:除外チェックリスト
- 図表150:米ドルの為替レート
- 図表151:調査手法
- 図表152:市場のサイジングに採用された検証手法
- 図表153:情報源
- 図表154:略語のリスト
Exhibits:
- Exhibits1: Executive Summary - Chart on Market Overview
- Exhibits2: Executive Summary - Data Table on Market Overview
- Exhibits3: Executive Summary - Chart on Global Market Characteristics
- Exhibits4: Executive Summary - Chart on Market By Geographical Landscape
- Exhibits5: Executive Summary - Chart on Market Segmentation by Distribution Channel
- Exhibits6: Executive Summary - Chart on Market Segmentation by Capacity
- Exhibits7: Executive Summary - Chart on Incremental Growth
- Exhibits8: Executive Summary - Data Table on Incremental Growth
- Exhibits9: Executive Summary - Chart on Vendor Market Positioning
- Exhibits10: Parent market
- Exhibits11: Market Characteristics
- Exhibits12: Offerings of vendors included in the market definition
- Exhibits13: Market segments
- Exhibits14: Chart on Global - Market size and forecast 2021-2026 ($ million)
- Exhibits15: Data Table on Global - Market size and forecast 2021-2026 ($ million)
- Exhibits16: Chart on Global Market: Year-over-year growth 2021-2026 (%)
- Exhibits17: Data Table on Global Market: Year-over-year growth 2021-2026 (%)
- Exhibits18: Five forces analysis - Comparison between2021 and 2026
- Exhibits19: Chart on Bargaining power of buyers - Impact of key factors 2021 and 2026
- Exhibits20: Bargaining power of suppliers - Impact of key factors in 2021 and 2026
- Exhibits21: Threat of new entrants - Impact of key factors in 2021 and 2026
- Exhibits22: Threat of substitutes - Impact of key factors in 2021 and 2026
- Exhibits23: Threat of rivalry - Impact of key factors in 2021 and 2026
- Exhibits24: Chart on Market condition - Five forces 2021 and 2026
- Exhibits25: Chart on Distribution Channel - Market share 2021-2026 (%)
- Exhibits26: Data Table on Distribution Channel - Market share 2021-2026 (%)
- Exhibits27: Chart on Comparison by Distribution Channel
- Exhibits28: Data Table on Comparison by Distribution Channel
- Exhibits29: Chart on Offline - Market size and forecast 2021-2026 ($ million)
- Exhibits30: Data Table on Offline - Market size and forecast 2021-2026 ($ million)
- Exhibits31: Chart on Offline - Year-over-year growth 2021-2026 (%)
- Exhibits32: Data Table on Offline - Year-over-year growth 2021-2026 (%)
- Exhibits33: Chart on Online - Market size and forecast 2021-2026 ($ million)
- Exhibits34: Data Table on Online - Market size and forecast 2021-2026 ($ million)
- Exhibits35: Chart on Online - Year-over-year growth 2021-2026 (%)
- Exhibits36: Data Table on Online - Year-over-year growth 2021-2026 (%)
- Exhibits37: Market opportunity by Distribution Channel ($ million)
- Exhibits38: Chart on Capacity - Market share 2021-2026 (%)
- Exhibits39: Data Table on Capacity - Market share 2021-2026 (%)
- Exhibits40: Chart on Comparison by Capacity
- Exhibits41: Data Table on Comparison by Capacity
- Exhibits42: Chart on 5-6 quarts - Market size and forecast 2021-2026 ($ million)
- Exhibits43: Data Table on 5-6 quarts - Market size and forecast 2021-2026 ($ million)
- Exhibits44: Chart on 5-6 quarts - Year-over-year growth 2021-2026 (%)
- Exhibits45: Data Table on 5-6 quarts - Year-over-year growth 2021-2026 (%)
- Exhibits46: Chart on Less than 5 quarts - Market size and forecast 2021-2026 ($ million)
- Exhibits47: Data Table on Less than 5 quarts - Market size and forecast 2021-2026 ($ million)
- Exhibits48: Chart on Less than 5 quarts - Year-over-year growth 2021-2026 (%)
- Exhibits49: Data Table on Less than 5 quarts - Year-over-year growth 2021-2026 (%)
- Exhibits50: Chart on Greater than 6 quarts - Market size and forecast 2021-2026 ($ million)
- Exhibits51: Data Table on Greater than 6 quarts - Market size and forecast 2021-2026 ($ million)
- Exhibits52: Chart on Greater than 6 quarts - Year-over-year growth 2021-2026 (%)
- Exhibits53: Data Table on Greater than 6 quarts - Year-over-year growth 2021-2026 (%)
- Exhibits54: Market opportunity by Capacity ($ million)
- Exhibits55: Analysis of price sensitivity, lifecycle, customer purchase basket, adoption rates, and purchase criteria
- Exhibits56: Chart on Market share By Geographical Landscape 2021-2026 (%)
- Exhibits57: Data Table on Market share By Geographical Landscape 2021-2026 (%)
- Exhibits58: Chart on Geographic comparison
- Exhibits59: Data Table on Geographic comparison
- Exhibits60: Chart on North America - Market size and forecast 2021-2026 ($ million)
- Exhibits61: Data Table on North America - Market size and forecast 2021-2026 ($ million)
- Exhibits62: Chart on North America - Year-over-year growth 2021-2026 (%)
- Exhibits63: Data Table on North America - Year-over-year growth 2021-2026 (%)
- Exhibits64: Chart on Europe - Market size and forecast 2021-2026 ($ million)
- Exhibits65: Data Table on Europe - Market size and forecast 2021-2026 ($ million)
- Exhibits66: Chart on Europe - Year-over-year growth 2021-2026 (%)
- Exhibits67: Data Table on Europe - Year-over-year growth 2021-2026 (%)
- Exhibits68: Chart on APAC - Market size and forecast 2021-2026 ($ million)
- Exhibits69: Data Table on APAC - Market size and forecast 2021-2026 ($ million)
- Exhibits70: Chart on APAC - Year-over-year growth 2021-2026 (%)
- Exhibits71: Data Table on APAC - Year-over-year growth 2021-2026 (%)
- Exhibits72: Chart on South America - Market size and forecast 2021-2026 ($ million)
- Exhibits73: Data Table on South America - Market size and forecast 2021-2026 ($ million)
- Exhibits74: Chart on South America - Year-over-year growth 2021-2026 (%)
- Exhibits75: Data Table on South America - Year-over-year growth 2021-2026 (%)
- Exhibits76: Chart on Middle East and Africa - Market size and forecast 2021-2026 ($ million)
- Exhibits77: Data Table on Middle East and Africa - Market size and forecast 2021-2026 ($ million)
- Exhibits78: Chart on Middle East and Africa - Year-over-year growth 2021-2026 (%)
- Exhibits79: Data Table on Middle East and Africa - Year-over-year growth 2021-2026 (%)
- Exhibits80: Chart on US - Market size and forecast 2021-2026 ($ million)
- Exhibits81: Data Table on US - Market size and forecast 2021-2026 ($ million)
- Exhibits82: Chart on US - Year-over-year growth 2021-2026 (%)
- Exhibits83: Data Table on US - Year-over-year growth 2021-2026 (%)
- Exhibits84: Chart on Germany - Market size and forecast 2021-2026 ($ million)
- Exhibits85: Data Table on Germany - Market size and forecast 2021-2026 ($ million)
- Exhibits86: Chart on Germany - Year-over-year growth 2021-2026 (%)
- Exhibits87: Data Table on Germany - Year-over-year growth 2021-2026 (%)
- Exhibits88: Chart on China - Market size and forecast 2021-2026 ($ million)
- Exhibits89: Data Table on China - Market size and forecast 2021-2026 ($ million)
- Exhibits90: Chart on China - Year-over-year growth 2021-2026 (%)
- Exhibits91: Data Table on China - Year-over-year growth 2021-2026 (%)
- Exhibits92: Chart on UK - Market size and forecast 2021-2026 ($ million)
- Exhibits93: Data Table on UK - Market size and forecast 2021-2026 ($ million)
- Exhibits94: Chart on UK - Year-over-year growth 2021-2026 (%)
- Exhibits95: Data Table on UK - Year-over-year growth 2021-2026 (%)
- Exhibits96: Chart on France - Market size and forecast 2021-2026 ($ million)
- Exhibits97: Data Table on France - Market size and forecast 2021-2026 ($ million)
- Exhibits98: Chart on France - Year-over-year growth 2021-2026 (%)
- Exhibits99: Data Table on France - Year-over-year growth 2021-2026 (%)
- Exhibits100: Market opportunity By Geographical Landscape ($ million)
- Exhibits101: Impact of drivers and challenges in 2021 and 2026
- Exhibits102: Overview on Criticality of inputs and Factors of differentiation
- Exhibits103: Overview on factors of disruption
- Exhibits104: Impact of key risks on business
- Exhibits105: Vendors covered
- Exhibits106: Matrix on vendor position and classification
- Exhibits107: Corelle Brands LLC - Overview
- Exhibits108: Corelle Brands LLC - Product / Service
- Exhibits109: Corelle Brands LLC - Key offerings
- Exhibits110: Glen Dimplex Group - Overview
- Exhibits111: Glen Dimplex Group - Product / Service
- Exhibits112: Glen Dimplex Group - Key offerings
- Exhibits113: Groupe SEB - Overview
- Exhibits114: Groupe SEB - Business segments
- Exhibits115: Groupe SEB - Key news
- Exhibits116: Groupe SEB - Key offerings
- Exhibits117: Groupe SEB - Segment focus
- Exhibits118: Hamilton Beach Brands Holding Co. - Overview
- Exhibits119: Hamilton Beach Brands Holding Co. - Product / Service
- Exhibits120: Hamilton Beach Brands Holding Co. - Key news
- Exhibits121: Hamilton Beach Brands Holding Co. - Key offerings
- Exhibits122: Koninklijke Philips NV - Overview
- Exhibits123: Koninklijke Philips NV - Business segments
- Exhibits124: Koninklijke Philips NV - Key news
- Exhibits125: Koninklijke Philips NV - Key offerings
- Exhibits126: Koninklijke Philips NV - Segment focus
- Exhibits127: Newell Brands Inc. - Overview
- Exhibits128: Newell Brands Inc. - Business segments
- Exhibits129: Newell Brands Inc. - Key news
- Exhibits130: Newell Brands Inc. - Key offerings
- Exhibits131: Newell Brands Inc. - Segment focus
- Exhibits132: Panasonic Corp. - Overview
- Exhibits133: Panasonic Corp. - Business segments
- Exhibits134: Panasonic Corp. - Key offerings
- Exhibits135: Panasonic Corp. - Segment focus
- Exhibits136: REDMOND Industrial group - Overview
- Exhibits137: REDMOND Industrial group - Product / Service
- Exhibits138: REDMOND Industrial group - Key offerings
- Exhibits139: Spectrum Brands Holdings Inc. - Overview
- Exhibits140: Spectrum Brands Holdings Inc. - Business segments
- Exhibits141: Spectrum Brands Holdings Inc. - Key news
- Exhibits142: Spectrum Brands Holdings Inc. - Key offerings
- Exhibits143: Spectrum Brands Holdings Inc. - Segment focus
- Exhibits144: Whirlpool Corp. - Overview
- Exhibits145: Whirlpool Corp. - Business segments
- Exhibits146: Whirlpool Corp. - Key offerings
- Exhibits147: Whirlpool Corp. - Segment focus
- Exhibits148: Inclusions checklist
- Exhibits149: Exclusions checklist
- Exhibits150: Currency conversion rates for US$
- Exhibits151: Research methodology
- Exhibits152: Validation techniques employed for market sizing
- Exhibits153: Information sources
- Exhibits154: List of abbreviations
Technavio has been monitoring the multicooker market and it is poised to grow by $ 1.35 bn during 2022-2026, decelerating at a CAGR of 16.45% during the forecast period. Our report on the multicooker market provides a holistic analysis, market size and forecast, trends, growth drivers, and challenges, as well as vendor analysis covering around 25 vendors.
The report offers an up-to-date analysis regarding the current global market scenario, latest trends and drivers, and the overall market environment. The market is driven by product innovation and portfolio extension leading to premiumization, product convenience and multiple functions enable a better cooking experience, and expansion of distribution networks.
The multicooker market analysis includes the distribution channel segment and geographic landscape.
Technavio's multicooker market is segmented as below:
By Distribution Channel
- Offline
- Online
By Geographical Landscape
- North America
- Europe
- APAC
- South America
- Middle East and Africa
This study identifies the integration of smart connectivity in multicookers as one of the prime reasons driving the multicooker market growth during the next few years. Also, changing dietary habits and rising consumer health consciousness and increased adoption of modular kitchens will lead to sizable demand in the market.
Technavio presents a detailed picture of the market by the way of study, synthesis, and summation of data from multiple sources by an analysis of key parameters. Our report on multicooker market covers the following areas:
- Multicooker market sizing
- Multicooker market forecast
- Multicooker market industry analysis
Technavio's robust vendor analysis is designed to help clients improve their market position, and in line with this, this report provides a detailed analysis of several leading multicooker market vendors that include Aroma Housewares Co., Breville Group Ltd., CHEFMAN, Corelle Brands LLC, De Longhi S.p.A, Domu Brands Ltd., Glen Dimplex Group, Gourmia Inc., Groupe SEB, Hamilton Beach Brands Holding Co., Hisense International Co. Ltd., John Mills Ltd., Koninklijke Philips NV, Mueller Direct, National Presto Industries Inc., Newell Brands Inc., Panasonic Corp., REDMOND Industrial group, Robert Bosch GmbH, SharkNinja Operating LLC, Spectrum Brands Holdings Inc., Sunpentown International Inc., Tiger Corp., TTK Prestige Ltd., and Whirlpool Corp. Also, the multicooker market analysis report includes information on upcoming trends and challenges that will influence market growth. This is to help companies strategize and leverage all forthcoming growth opportunities.
The study was conducted using an objective combination of primary and secondary information including inputs from key participants in the industry. The report contains a comprehensive market and vendor landscape in addition to an analysis of the key vendors.
Technavio presents a detailed picture of the market by the way of study, synthesis, and summation of data from multiple sources by an analysis of key parameters such as profit, pricing, competition, and promotions. It presents various market facets by identifying the key industry influencers. The data presented is comprehensive, reliable, and a result of extensive research - both primary and secondary. Technavio's market research reports provide a complete competitive landscape and an in-depth vendor selection methodology and analysis using qualitative and quantitative research to forecast the accurate market growth.
Table of Contents
1 Executive Summary
- 1.1 Market overview
- Exhibit 01: Executive Summary - Chart on Market Overview
- Exhibit 02: Executive Summary - Data Table on Market Overview
- Exhibit 03: Executive Summary - Chart on Global Market Characteristics
- Exhibit 04: Executive Summary - Chart on Market By Geographical Landscape
- Exhibit 05: Executive Summary - Chart on Market Segmentation by Distribution Channel
- Exhibit 06: Executive Summary - Chart on Market Segmentation by Capacity
- Exhibit 07: Executive Summary - Chart on Incremental Growth
- Exhibit 08: Executive Summary - Data Table on Incremental Growth
- Exhibit 09: Executive Summary - Chart on Vendor Market Positioning
2 Market Landscape
- 2.1 Market ecosystem
- Exhibit 10: Parent market
- Exhibit 11: Market Characteristics
3 Market Sizing
- 3.1 Market definition
- Exhibit 12: Offerings of vendors included in the market definition
- 3.2 Market segment analysis
- Exhibit 13: Market segments
- 3.3 Market size 2021
- 3.4 Market outlook: Forecast for 2021-2026
- Exhibit 14: Chart on Global - Market size and forecast 2021-2026 ($ million)
- Exhibit 15: Data Table on Global - Market size and forecast 2021-2026 ($ million)
- Exhibit 16: Chart on Global Market: Year-over-year growth 2021-2026 (%)
- Exhibit 17: Data Table on Global Market: Year-over-year growth 2021-2026 (%)
4 Five Forces Analysis
- 4.1 Five forces summary
- Exhibit 18: Five forces analysis - Comparison between2021 and 2026
- 4.2 Bargaining power of buyers
- Exhibit 19: Chart on Bargaining power of buyers - Impact of key factors 2021 and 2026
- 4.3 Bargaining power of suppliers
- Exhibit 20: Bargaining power of suppliers - Impact of key factors in 2021 and 2026
- 4.4 Threat of new entrants
- Exhibit 21: Threat of new entrants - Impact of key factors in 2021 and 2026
- 4.5 Threat of substitutes
- Exhibit 22: Threat of substitutes - Impact of key factors in 2021 and 2026
- 4.6 Threat of rivalry
- Exhibit 23: Threat of rivalry - Impact of key factors in 2021 and 2026
- 4.7 Market condition
- Exhibit 24: Chart on Market condition - Five forces 2021 and 2026
5 Market Segmentation by Distribution Channel
- 5.1 Market segments
- Exhibit 25: Chart on Distribution Channel - Market share 2021-2026 (%)
- Exhibit 26: Data Table on Distribution Channel - Market share 2021-2026 (%)
- 5.2 Comparison by Distribution Channel
- Exhibit 27: Chart on Comparison by Distribution Channel
- Exhibit 28: Data Table on Comparison by Distribution Channel
- 5.3 Offline - Market size and forecast 2021-2026
- Exhibit 29: Chart on Offline - Market size and forecast 2021-2026 ($ million)
- Exhibit 30: Data Table on Offline - Market size and forecast 2021-2026 ($ million)
- Exhibit 31: Chart on Offline - Year-over-year growth 2021-2026 (%)
- Exhibit 32: Data Table on Offline - Year-over-year growth 2021-2026 (%)
- 5.4 Online - Market size and forecast 2021-2026
- Exhibit 33: Chart on Online - Market size and forecast 2021-2026 ($ million)
- Exhibit 34: Data Table on Online - Market size and forecast 2021-2026 ($ million)
- Exhibit 35: Chart on Online - Year-over-year growth 2021-2026 (%)
- Exhibit 36: Data Table on Online - Year-over-year growth 2021-2026 (%)
- 5.5 Market opportunity by Distribution Channel
- Exhibit 37: Market opportunity by Distribution Channel ($ million)
6 Market Segmentation by Capacity
- 6.1 Market segments
- Exhibit 38: Chart on Capacity - Market share 2021-2026 (%)
- Exhibit 39: Data Table on Capacity - Market share 2021-2026 (%)
- 6.2 Comparison by Capacity
- Exhibit 40: Chart on Comparison by Capacity
- Exhibit 41: Data Table on Comparison by Capacity
- 6.3 5-6 quarts - Market size and forecast 2021-2026
- Exhibit 42: Chart on 5-6 quarts - Market size and forecast 2021-2026 ($ million)
- Exhibit 43: Data Table on 5-6 quarts - Market size and forecast 2021-2026 ($ million)
- Exhibit 44: Chart on 5-6 quarts - Year-over-year growth 2021-2026 (%)
- Exhibit 45: Data Table on 5-6 quarts - Year-over-year growth 2021-2026 (%)
- 6.4 Less than 5 quarts - Market size and forecast 2021-2026
- Exhibit 46: Chart on Less than 5 quarts - Market size and forecast 2021-2026 ($ million)
- Exhibit 47: Data Table on Less than 5 quarts - Market size and forecast 2021-2026 ($ million)
- Exhibit 48: Chart on Less than 5 quarts - Year-over-year growth 2021-2026 (%)
- Exhibit 49: Data Table on Less than 5 quarts - Year-over-year growth 2021-2026 (%)
- 6.5 Greater than 6 quarts - Market size and forecast 2021-2026
- Exhibit 50: Chart on Greater than 6 quarts - Market size and forecast 2021-2026 ($ million)
- Exhibit 51: Data Table on Greater than 6 quarts - Market size and forecast 2021-2026 ($ million)
- Exhibit 52: Chart on Greater than 6 quarts - Year-over-year growth 2021-2026 (%)
- Exhibit 53: Data Table on Greater than 6 quarts - Year-over-year growth 2021-2026 (%)
- 6.6 Market opportunity by Capacity
- Exhibit 54: Market opportunity by Capacity ($ million)
7 Customer Landscape
- 7.1 Customer landscape overview
- Exhibit 55: Analysis of price sensitivity, lifecycle, customer purchase basket, adoption rates, and purchase criteria
8 Geographic Landscape
- 8.1 Geographic segmentation
- Exhibit 56: Chart on Market share By Geographical Landscape 2021-2026 (%)
- Exhibit 57: Data Table on Market share By Geographical Landscape 2021-2026 (%)
- 8.2 Geographic comparison
- Exhibit 58: Chart on Geographic comparison
- Exhibit 59: Data Table on Geographic comparison
- 8.3 North America - Market size and forecast 2021-2026
- Exhibit 60: Chart on North America - Market size and forecast 2021-2026 ($ million)
- Exhibit 61: Data Table on North America - Market size and forecast 2021-2026 ($ million)
- Exhibit 62: Chart on North America - Year-over-year growth 2021-2026 (%)
- Exhibit 63: Data Table on North America - Year-over-year growth 2021-2026 (%)
- 8.4 Europe - Market size and forecast 2021-2026
- Exhibit 64: Chart on Europe - Market size and forecast 2021-2026 ($ million)
- Exhibit 65: Data Table on Europe - Market size and forecast 2021-2026 ($ million)
- Exhibit 66: Chart on Europe - Year-over-year growth 2021-2026 (%)
- Exhibit 67: Data Table on Europe - Year-over-year growth 2021-2026 (%)
- 8.5 APAC - Market size and forecast 2021-2026
- Exhibit 68: Chart on APAC - Market size and forecast 2021-2026 ($ million)
- Exhibit 69: Data Table on APAC - Market size and forecast 2021-2026 ($ million)
- Exhibit 70: Chart on APAC - Year-over-year growth 2021-2026 (%)
- Exhibit 71: Data Table on APAC - Year-over-year growth 2021-2026 (%)
- 8.6 South America - Market size and forecast 2021-2026
- Exhibit 72: Chart on South America - Market size and forecast 2021-2026 ($ million)
- Exhibit 73: Data Table on South America - Market size and forecast 2021-2026 ($ million)
- Exhibit 74: Chart on South America - Year-over-year growth 2021-2026 (%)
- Exhibit 75: Data Table on South America - Year-over-year growth 2021-2026 (%)
- 8.7 Middle East and Africa - Market size and forecast 2021-2026
- Exhibit 76: Chart on Middle East and Africa - Market size and forecast 2021-2026 ($ million)
- Exhibit 77: Data Table on Middle East and Africa - Market size and forecast 2021-2026 ($ million)
- Exhibit 78: Chart on Middle East and Africa - Year-over-year growth 2021-2026 (%)
- Exhibit 79: Data Table on Middle East and Africa - Year-over-year growth 2021-2026 (%)
- 8.8 US - Market size and forecast 2021-2026
- Exhibit 80: Chart on US - Market size and forecast 2021-2026 ($ million)
- Exhibit 81: Data Table on US - Market size and forecast 2021-2026 ($ million)
- Exhibit 82: Chart on US - Year-over-year growth 2021-2026 (%)
- Exhibit 83: Data Table on US - Year-over-year growth 2021-2026 (%)
- 8.9 Germany - Market size and forecast 2021-2026
- Exhibit 84: Chart on Germany - Market size and forecast 2021-2026 ($ million)
- Exhibit 85: Data Table on Germany - Market size and forecast 2021-2026 ($ million)
- Exhibit 86: Chart on Germany - Year-over-year growth 2021-2026 (%)
- Exhibit 87: Data Table on Germany - Year-over-year growth 2021-2026 (%)
- 8.10 China - Market size and forecast 2021-2026
- Exhibit 88: Chart on China - Market size and forecast 2021-2026 ($ million)
- Exhibit 89: Data Table on China - Market size and forecast 2021-2026 ($ million)
- Exhibit 90: Chart on China - Year-over-year growth 2021-2026 (%)
- Exhibit 91: Data Table on China - Year-over-year growth 2021-2026 (%)
- 8.11 UK - Market size and forecast 2021-2026
- Exhibit 92: Chart on UK - Market size and forecast 2021-2026 ($ million)
- Exhibit 93: Data Table on UK - Market size and forecast 2021-2026 ($ million)
- Exhibit 94: Chart on UK - Year-over-year growth 2021-2026 (%)
- Exhibit 95: Data Table on UK - Year-over-year growth 2021-2026 (%)
- 8.12 France - Market size and forecast 2021-2026
- Exhibit 96: Chart on France - Market size and forecast 2021-2026 ($ million)
- Exhibit 97: Data Table on France - Market size and forecast 2021-2026 ($ million)
- Exhibit 98: Chart on France - Year-over-year growth 2021-2026 (%)
- Exhibit 99: Data Table on France - Year-over-year growth 2021-2026 (%)
- 8.13 Market opportunity By Geographical Landscape
- Exhibit 100: Market opportunity By Geographical Landscape ($ million)
9 Drivers, Challenges, and Trends
- 9.1 Market drivers
- 9.2 Market challenges
- 9.3 Impact of drivers and challenges
- Exhibit 101: Impact of drivers and challenges in 2021 and 2026
- 9.4 Market trends
10 Vendor Landscape
- 10.1 Overview
- 10.2 Vendor landscape
- Exhibit 102: Overview on Criticality of inputs and Factors of differentiation
- 10.3 Landscape disruption
- Exhibit 103: Overview on factors of disruption
- 10.4 Industry risks
- Exhibit 104: Impact of key risks on business
11 Vendor Analysis
- 11.1 Vendors covered
- Exhibit 105: Vendors covered
- 11.2 Market positioning of vendors
- Exhibit 106: Matrix on vendor position and classification
- 11.3 Corelle Brands LLC
- Exhibit 107: Corelle Brands LLC - Overview
- Exhibit 108: Corelle Brands LLC - Product / Service
- Exhibit 109: Corelle Brands LLC - Key offerings
- 11.4 Glen Dimplex Group
- Exhibit 110: Glen Dimplex Group - Overview
- Exhibit 111: Glen Dimplex Group - Product / Service
- Exhibit 112: Glen Dimplex Group - Key offerings
- 11.5 Groupe SEB
- Exhibit 113: Groupe SEB - Overview
- Exhibit 114: Groupe SEB - Business segments
- Exhibit 115: Groupe SEB - Key news
- Exhibit 116: Groupe SEB - Key offerings
- Exhibit 117: Groupe SEB - Segment focus
- 11.6 Hamilton Beach Brands Holding Co.
- Exhibit 118: Hamilton Beach Brands Holding Co. - Overview
- Exhibit 119: Hamilton Beach Brands Holding Co. - Product / Service
- Exhibit 120: Hamilton Beach Brands Holding Co. - Key news
- Exhibit 121: Hamilton Beach Brands Holding Co. - Key offerings
- 11.7 Koninklijke Philips NV
- Exhibit 122: Koninklijke Philips NV - Overview
- Exhibit 123: Koninklijke Philips NV - Business segments
- Exhibit 124: Koninklijke Philips NV - Key news
- Exhibit 125: Koninklijke Philips NV - Key offerings
- Exhibit 126: Koninklijke Philips NV - Segment focus
- 11.8 Newell Brands Inc.
- Exhibit 127: Newell Brands Inc. - Overview
- Exhibit 128: Newell Brands Inc. - Business segments
- Exhibit 129: Newell Brands Inc. - Key news
- Exhibit 130: Newell Brands Inc. - Key offerings
- Exhibit 131: Newell Brands Inc. - Segment focus
- 11.9 Panasonic Corp.
- Exhibit 132: Panasonic Corp. - Overview
- Exhibit 133: Panasonic Corp. - Business segments
- Exhibit 134: Panasonic Corp. - Key offerings
- Exhibit 135: Panasonic Corp. - Segment focus
- 11.10 REDMOND Industrial group
- Exhibit 136: REDMOND Industrial group - Overview
- Exhibit 137: REDMOND Industrial group - Product / Service
- Exhibit 138: REDMOND Industrial group - Key offerings
- 11.11 Spectrum Brands Holdings Inc.
- Exhibit 139: Spectrum Brands Holdings Inc. - Overview
- Exhibit 140: Spectrum Brands Holdings Inc. - Business segments
- Exhibit 141: Spectrum Brands Holdings Inc. - Key news
- Exhibit 142: Spectrum Brands Holdings Inc. - Key offerings
- Exhibit 143: Spectrum Brands Holdings Inc. - Segment focus
- 11.12 Whirlpool Corp.
- Exhibit 144: Whirlpool Corp. - Overview
- Exhibit 145: Whirlpool Corp. - Business segments
- Exhibit 146: Whirlpool Corp. - Key offerings
- Exhibit 147: Whirlpool Corp. - Segment focus
12 Appendix
- 12.1 Scope of the report
- 12.2 Inclusions and exclusions checklist
- Exhibit 148: Inclusions checklist
- Exhibit 149: Exclusions checklist
- 12.3 Currency conversion rates for US$
- Exhibit 150: Currency conversion rates for US$
- 12.4 Research methodology
- Exhibit 151: Research methodology
- Exhibit 152: Validation techniques employed for market sizing
- Exhibit 153: Information sources
- 12.5 List of abbreviations
- Exhibit 154: List of abbreviations