|
|
市場調査レポート
商品コード
1072814
乗用車用セキュリティシステムの世界市場(2022年~2026年)Global Passenger Car Security Systems Market 2022-2026 |
||||||
|
|
|||||||
|
● お客様のご希望に応じて、既存データの加工や未掲載情報(例:国別セグメント)の追加などの対応が可能です。 詳細はお問い合わせください。 |
|||||||


| 乗用車用セキュリティシステムの世界市場(2022年~2026年) |
|
出版日: 2022年04月28日
発行: TechNavio
ページ情報: 英文 120 Pages
納期: 即納可能
|
- 全表示
- 概要
- 図表
- 目次
世界の乗用車用セキュリティシステムの市場規模は、予測期間中に3.09%のCAGRで減速し、2022年から2026年の間に11億4,000万米ドルに達すると予測されています。
自動車盗難の増加、コネクテッドカーの出現、およびアジア太平洋地域の新興国での需要増加などによって、同市場は牽引されています。
当レポートでは、世界の乗用車用セキュリティシステム市場を調査し、市場規模・予測、最新動向、成長促進要因、課題などの情報を提供しています。
目次
第1章 エグゼクティブサマリー
- 市場概要
第2章 市場情勢
- 市場のエコシステム
第3章 市場規模
- 市場定義
- 市場セグメント分析
- 市場規模(2021年)
- 市場の見通し:予測(2021年~2026年)
第4章 ファイブフォース分析
- ファイブフォースの要約
- 買い手の交渉力
- 供給企業の交渉力
- 新規参入業者の脅威
- 代替品の脅威
- ライバルの脅威
- 市況
第5章 市場セグメンテーション:製品別
- 市場セグメント
- 比較:製品別
- イモビライザー - 市場規模と予測(2021年~2026年)
- セントラルロックシステム - 市場規模と予測(2021年~2026年)
- 警報システム - 市場規模と予測(2021年~2026年)
- RKEとその他 - 市場規模と予測(2021年~2026年)
- 市場機会:製品別
第6章 顧客情勢
- 促進要因または価格感応度、採用ライフサイクル、顧客価格バスケットの重要性、採用率、主要な購入基準を比較した顧客情勢マトリックス
- 顧客情勢の概要
第7章 地理的情勢
- 地理的セグメンテーション
- 地理的比較
- アジア太平洋 - 市場規模と予測(2021年~2026年)
- 北米 - 市場規模と予測(2021年~2026年)
- 欧州 - 市場規模と予測(2021年~2026年)
- 南米 - 市場規模と予測(2021年~2026年)
- 中東・アフリカ - 市場規模と予測(2021年~2026年)
- 中国 - 市場規模と予測(2021年~2026年)
- 米国 - 市場規模と予測(2021年~2026年)
- 日本 - 市場規模と予測(2021年~2026年)
- インド - 市場規模と予測(2021年~2026年)
- ドイツ - 市場規模と予測(2021年~2026年)
- 市場機会:地理的情勢別
第8章 促進要因、課題、動向
- 市場促進要因
- 自動車盗難の増加
- コネクテッドカーの出現
- アジア太平洋地域の新興諸国での需要増加
- 市場の課題
- 自動車製造の減速
- プレミアムセキュリティ機能の高コスト
- 車両セキュリティシステムで使用される電子部品の潜在的な故障
- 促進要因と課題の影響
- 市場動向
- 生体認証技術の成長
- 乗用車向けスマートモバイルアプリの利用拡大
- キーレスカーに関連するリスクの増加
第9章 ベンダー情勢
- 概要
- ベンダー情勢
- 破壊的情勢
- 業界リスク
第10章 ベンダー分析
- 対象ベンダー
- ベンダーの市場ポジショニング
- Alps Alpine Co. Ltd.
- Continental AG
- DENSO Corp.
- HELLA GmbH and Co. KG
- Lear Corp.
- Mitsubishi Electric Corp.
- Robert Bosch GmbH
図表:
- 図表1:エグゼクティブサマリー - 市場概要のチャート
- 図表2:エグゼクティブサマリー - 市場概要のデータ表
- 図表3:エグゼクティブサマリー - 世界市場の特徴に関するチャート
- 図表4:エグゼクティブサマリー - 市場チャート:地理的情勢別
- 図表5:エグゼクティブサマリー - 市場セグメンテーションに関するチャート:製品別
- 図表6:エグゼクティブサマリー - 増分成長に関するチャート
- 図表7:エグゼクティブサマリー - 増分成長に関するデータ表
- 図表8:エグゼクティブサマリー - ベンダーの市場ポジショニングに関するチャート
- 図表9:親市場
- 図表10:市場の特徴
- 図表11:市場定義に含まれるベンダーの提供
- 図表12:市場セグメント
- 図表13:世界のチャート - 市場規模と予測(2021年~2026年)
- 図表14:世界のデータ表 - 市場規模と予測(2021年~2026年)
- 図表15:世界市場のチャート:前年比成長率(%)(2021年~2026年)
- 図表16:世界市場のデータ表:前年比成長率(%)(2021年~2026年)
- 図表17:ファイブフォース分析 - 比較(2021年と2026年)
- 図表18:買い手の交渉力に関するチャート - 主要な要因の影響(2021年と2026年)
- 図表19:供給企業の交渉力 - 主要な要因の影響(2021年と2026年)
- 図表20:新規参入業者の脅威 - 主要な要因の影響(2021年と2026年)
- 図表21:代替品の脅威 - 主要な要因の影響(2021年と2026年)
- 図表22:ライバルの脅威 - 主要な要因の影響(2021年と2026年)
- 図表23:市況のチャート - ファイブフォース(2021年と2026年)
- 図表24:製品のチャート - 市場シェア(%)(2021年~2026年)
- 図表25:製品のデータ表 - 市場シェア(%)(2021年~2026年)
- 図表26:比較のチャート:製品別
- 図表27:比較のデータ表:製品別
- 図表28:イモビライザーのチャート - 市場規模と予測(2021年~2026年)
- 図表29:イモビライザーのデータ表 - 市場規模と予測(2021年~2026年)
- 図表30:イモビライザーのチャート - 前年比成長率(%)(2021年~2026年)
- 図表31:イモビライザーのデータ表 - 前年比成長率(%)(2021年~2026年)
- 図表32:セントラルロックシステムのチャート - 市場規模と予測(2021年~2026年)
- 図表33:セントラルロックシステムのデータ表 - 市場規模と予測(2021年~2026年)
- 図表34:セントラルロックシステムのチャート - 前年比成長率(%)(2021年~2026年)
- 図表35:セントラルロックシステムのデータ表 - 前年比成長率(%)(2021年~2026年)
- 図表36:警報システムのチャート - 市場規模と予測(2021年~2026年)
- 図表37:警報システムのデータ表 - 市場規模と予測(2021年~2026年)
- 図表38:警報システムのチャート - 前年比成長率(%)(2021年~2026年)
- 図表39:警報システムのデータ表 - 前年比成長率(%)(2021年~2026年)
- 図表40:RKEとその他のチャート - 市場規模と予測(2021年~2026年)
- 図表41:RKEとその他のデータ表 - 市場規模と予測(2021年~2026年)
- 図表42:RKEとその他のチャート - 前年比成長率(%)(2021年~2026年)
- 図表43:RKEとその他のデータ表 - 前年比成長率(%)(2021年~2026年)
- 図表44:市場機会:製品別
- 図表45:価格感応度、ライフサイクル、顧客購入バスケット、採用率、購入基準の分析
- 図表46:市場シェアのチャート:地理的情勢別(%)(2021年~2026年)
- 図表47:市場シェアのデータ表:地理的情勢別(%)(2021年~2026年)
- 図表48:地理的比較のチャート
- 図表49:地理的比較のデータ表
- 図表50:アジア太平洋のチャート - 市場規模と予測(2021年~2026年)
- 図表51:アジア太平洋のデータ表 - 市場規模と予測(2021年~2026年)
- 図表52:アジア太平洋のチャート - 前年比成長率(%)(2021年~2026年)
- 図表53:アジア太平洋のデータ表 - 前年比成長率(%)(2021年~2026年)
- 図表54:北米のチャート - 市場規模と予測(2021年~2026年)
- 図表55:北米のデータ表 - 市場規模と予測(2021年~2026年)
- 図表56:北米のチャート - 前年比成長率(%)(2021年~2026年)
- 図表57:北米のデータ表 - 前年比成長率(%)(2021年~2026年)
- 図表58:欧州のチャート - 市場規模と予測(2021年~2026年)
- 図表59:欧州のデータ表 - 市場規模と予測(2021年~2026年)
- 図表60:欧州のチャート - 前年比成長率(%)(2021年~2026年)
- 図表61:欧州のデータ表 - 前年比成長率(%)(2021年~2026年)
- 図表62:南米のチャート - 市場規模と予測(2021年~2026年)
- 図表63:南米のデータ表 - 市場規模と予測(2021年~2026年)
- 図表64:南米のチャート - 前年比成長率(%)(2021年~2026年)
- 図表65:南米のデータ表 - 前年比成長率(%)(2021年~2026年)
- 図表66:中東・アフリカのチャート - 市場規模と予測(2021年~2026年)
- 図表67:中東・アフリカのデータ表 - 市場規模と予測(2021年~2026年)
- 図表68:中東・アフリカのチャート - 前年比成長率(%)(2021年~2026年)
- 図表69:中東・アフリカのデータ表 - 前年比成長率(%)(2021年~2026年)
- 図表70:中国のチャート - 市場規模と予測(2021年~2026年)
- 図表71:中国のデータ表 - 市場規模と予測(2021年~2026年)
- 図表72:中国のチャート - 前年比成長率(%)(2021年~2026年)
- 図表73:中国のデータ表 - 前年比成長率(%)(2021年~2026年)
- 図表74:米国のチャート - 市場規模と予測(2021年~2026年)
- 図表75:米国のデータ表 - 市場規模と予測(2021年~2026年)
- 図表76:米国のチャート - 前年比成長率(%)(2021年~2026年)
- 図表77:米国のデータ表 - 前年比成長率(%)(2021年~2026年)
- 図表78:日本のチャート - 市場規模と予測(2021年~2026年)
- 図表79:日本のデータ表 - 市場規模と予測(2021年~2026年)
- 図表80:日本のチャート - 前年比成長率(%)(2021年~2026年)
- 図表81:日本のデータ表 - 前年比成長率(%)(2021年~2026年)
- 図表82:インドのチャート - 市場規模と予測(2021年~2026年)
- 図表83:インドのデータ表 - 市場規模と予測(2021年~2026年)
- 図表84:インドのチャート - 前年比成長率(%)(2021年~2026年)
- 図表85:インドのデータ表 - 前年比成長率(%)(2021年~2026年)
- 図表86:ドイツのチャート - 市場規模と予測(2021年~2026年)
- 図表87:ドイツのデータ表 - 市場規模と予測(2021年~2026年)
- 図表88:ドイツのチャート - 前年比成長率(%)(2021年~2026年)
- 図表89:ドイツのデータ表 - 前年比成長率(%)(2021年~2026年)
- 図表90:市場機会:地理的情勢別
- 図表91:促進要因と課題の影響(2021年と2026年)
- 図表92:インプットの重要性と差別化の要因に関する概要
- 図表93:混乱の要因の概要
- 図表94:主要リスクがビジネスに与える影響
- 図表95:対象ベンダー
- 図表96:ベンダーポジションと分類に関するマトリックス
- 図表97:Alps Alpine Co. Ltd. - 概要
- 図表98:Alps Alpine Co. Ltd. - 事業セグメント
- 図表99:Alps Alpine Co. Ltd. - 重要なニュース
- 図表100:Alps Alpine Co. Ltd. - 主な製品
- 図表101:Alps Alpine Co. Ltd. - セグメントフォーカス
- 図表102:Continental AG - 概要
- 図表103:Continental AG - 事業セグメント
- 図表104:Continental AG - 重要なニュース
- 図表105:Continental AG - 主な製品
- 図表106:Continental AG - セグメントフォーカス
- 図表107:DENSO Corp. - 概要
- 図表108:DENSO Corp. - 事業セグメント
- 図表109:DENSO Corp. - 重要なニュース
- 図表110:DENSO Corp. - 主な製品
- 図表111:DENSO Corp. - セグメントフォーカス
- 図表112:HELLA GmbH and Co. KG - 概要
- 図表113:HELLA GmbH and Co. KG - 事業セグメント
- 図表114:HELLA GmbH and Co. KG - 主な製品
- 図表115:HELLA GmbH and Co. KG - セグメントフォーカス
- 図表116:Lear Corp. - 概要
- 図表117:Lear Corp. - 事業セグメント
- 図表118:Lear Corp. - 重要なニュース
- 図表119:Lear Corp. - 主な製品
- 図表120:Lear Corp. - セグメントフォーカス
- 図表121:Mitsubishi Electric Corp. - 概要
- 図表122:Mitsubishi Electric Corp. - 事業セグメント
- 図表123:Mitsubishi Electric Corp. - 重要なニュース
- 図表124:Mitsubishi Electric Corp. - 主な製品
- 図表125:Mitsubishi Electric Corp. - セグメントフォーカス
- 図表126:Robert Bosch GmbH - 概要
- 図表127:Robert Bosch GmbH - 事業セグメント
- 図表128:Robert Bosch GmbH - 重要なニュース
- 図表129:Robert Bosch GmbH - 主な製品
- 図表130:Robert Bosch GmbH - セグメントフォーカス
- 図表131:Tokai Rika Co. Ltd. - 概要
- 図表132:Tokai Rika Co. Ltd. - 製品/サービス
- 図表133:Tokai Rika Co. Ltd. - 主な製品
- 図表134:Valeo SA - 概要
- 図表135:Valeo SA - 事業セグメント
- 図表136:Valeo SA - 主な製品
- 図表137:Valeo SA - セグメントフォーカス
- 図表138:ZF Friedrichshafen AG - 概要
- 図表139:ZF Friedrichshafen AG - 事業セグメント
- 図表140:ZF Friedrichshafen AG - 重要なニュース
- 図表141:ZF Friedrichshafen AG - 主な製品
- 図表142:ZF Friedrichshafen AG - セグメントフォーカス
- 図表143:包含チェックリスト
- 図表144:除外チェックリスト
- 図表145:米ドルの為替レート
- 図表146:調査手法
- 図表147:市場のサイジングに採用された検証手法
- 図表148:情報源
- 図表149:略語のリスト
Exhibits:
- Exhibits1: Executive Summary - Chart on Market Overview
- Exhibits2: Executive Summary - Data Table on Market Overview
- Exhibits3: Executive Summary - Chart on Global Market Characteristics
- Exhibits4: Executive Summary - Chart on Market By Geographical Landscape
- Exhibits5: Executive Summary - Chart on Market Segmentation by Product
- Exhibits6: Executive Summary - Chart on Incremental Growth
- Exhibits7: Executive Summary - Data Table on Incremental Growth
- Exhibits8: Executive Summary - Chart on Vendor Market Positioning
- Exhibits9: Parent market
- Exhibits10: Market Characteristics
- Exhibits11: Offerings of vendors included in the market definition
- Exhibits12: Market segments
- Exhibits13: Chart on Global - Market size and forecast 2021-2026 ($ million)
- Exhibits14: Data Table on Global - Market size and forecast 2021-2026 ($ million)
- Exhibits15: Chart on Global Market: Year-over-year growth 2021-2026 (%)
- Exhibits16: Data Table on Global Market: Year-over-year growth 2021-2026 (%)
- Exhibits17: Five forces analysis - Comparison between2021 and 2026
- Exhibits18: Chart on Bargaining power of buyers - Impact of key factors 2021 and 2026
- Exhibits19: Bargaining power of suppliers - Impact of key factors in 2021 and 2026
- Exhibits20: Threat of new entrants - Impact of key factors in 2021 and 2026
- Exhibits21: Threat of substitutes - Impact of key factors in 2021 and 2026
- Exhibits22: Threat of rivalry - Impact of key factors in 2021 and 2026
- Exhibits23: Chart on Market condition - Five forces 2021 and 2026
- Exhibits24: Chart on Product - Market share 2021-2026 (%)
- Exhibits25: Data Table on Product - Market share 2021-2026 (%)
- Exhibits26: Chart on Comparison by Product
- Exhibits27: Data Table on Comparison by Product
- Exhibits28: Chart on Immobilizer - Market size and forecast 2021-2026 ($ million)
- Exhibits29: Data Table on Immobilizer - Market size and forecast 2021-2026 ($ million)
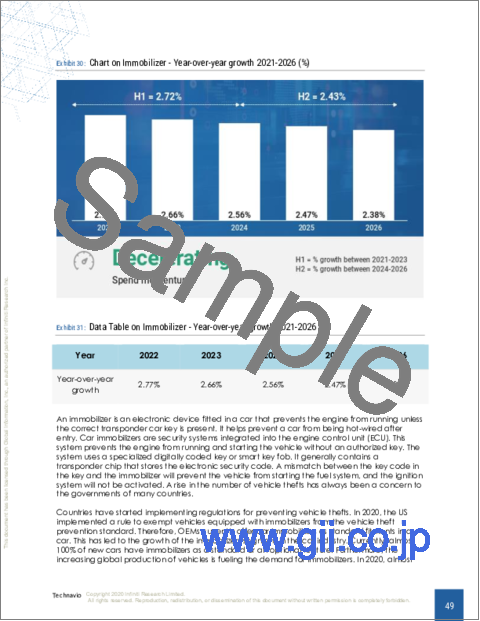
- Exhibits30: Chart on Immobilizer - Year-over-year growth 2021-2026 (%)
- Exhibits31: Data Table on Immobilizer - Year-over-year growth 2021-2026 (%)
- Exhibits32: Chart on Central lock system - Market size and forecast 2021-2026 ($ million)
- Exhibits33: Data Table on Central lock system - Market size and forecast 2021-2026 ($ million)
- Exhibits34: Chart on Central lock system - Year-over-year growth 2021-2026 (%)
- Exhibits35: Data Table on Central lock system - Year-over-year growth 2021-2026 (%)
- Exhibits36: Chart on Alarm system - Market size and forecast 2021-2026 ($ million)
- Exhibits37: Data Table on Alarm system - Market size and forecast 2021-2026 ($ million)
- Exhibits38: Chart on Alarm system - Year-over-year growth 2021-2026 (%)
- Exhibits39: Data Table on Alarm system - Year-over-year growth 2021-2026 (%)
- Exhibits40: Chart on RKE and others - Market size and forecast 2021-2026 ($ million)
- Exhibits41: Data Table on RKE and others - Market size and forecast 2021-2026 ($ million)
- Exhibits42: Chart on RKE and others - Year-over-year growth 2021-2026 (%)
- Exhibits43: Data Table on RKE and others - Year-over-year growth 2021-2026 (%)
- Exhibits44: Market opportunity by Product ($ million)
- Exhibits45: Analysis of price sensitivity, lifecycle, customer purchase basket, adoption rates, and purchase criteria
- Exhibits46: Chart on Market share By Geographical Landscape 2021-2026 (%)
- Exhibits47: Data Table on Market share By Geographical Landscape 2021-2026 (%)
- Exhibits48: Chart on Geographic comparison
- Exhibits49: Data Table on Geographic comparison
- Exhibits50: Chart on APAC - Market size and forecast 2021-2026 ($ million)
- Exhibits51: Data Table on APAC - Market size and forecast 2021-2026 ($ million)
- Exhibits52: Chart on APAC - Year-over-year growth 2021-2026 (%)
- Exhibits53: Data Table on APAC - Year-over-year growth 2021-2026 (%)
- Exhibits54: Chart on North America - Market size and forecast 2021-2026 ($ million)
- Exhibits55: Data Table on North America - Market size and forecast 2021-2026 ($ million)
- Exhibits56: Chart on North America - Year-over-year growth 2021-2026 (%)
- Exhibits57: Data Table on North America - Year-over-year growth 2021-2026 (%)
- Exhibits58: Chart on Europe - Market size and forecast 2021-2026 ($ million)
- Exhibits59: Data Table on Europe - Market size and forecast 2021-2026 ($ million)
- Exhibits60: Chart on Europe - Year-over-year growth 2021-2026 (%)
- Exhibits61: Data Table on Europe - Year-over-year growth 2021-2026 (%)
- Exhibits62: Chart on South America - Market size and forecast 2021-2026 ($ million)
- Exhibits63: Data Table on South America - Market size and forecast 2021-2026 ($ million)
- Exhibits64: Chart on South America - Year-over-year growth 2021-2026 (%)
- Exhibits65: Data Table on South America - Year-over-year growth 2021-2026 (%)
- Exhibits66: Chart on Middle East and Africa - Market size and forecast 2021-2026 ($ million)
- Exhibits67: Data Table on Middle East and Africa - Market size and forecast 2021-2026 ($ million)
- Exhibits68: Chart on Middle East and Africa - Year-over-year growth 2021-2026 (%)
- Exhibits69: Data Table on Middle East and Africa - Year-over-year growth 2021-2026 (%)
- Exhibits70: Chart on China - Market size and forecast 2021-2026 ($ million)
- Exhibits71: Data Table on China - Market size and forecast 2021-2026 ($ million)
- Exhibits72: Chart on China - Year-over-year growth 2021-2026 (%)
- Exhibits73: Data Table on China - Year-over-year growth 2021-2026 (%)
- Exhibits74: Chart on US - Market size and forecast 2021-2026 ($ million)
- Exhibits75: Data Table on US - Market size and forecast 2021-2026 ($ million)
- Exhibits76: Chart on US - Year-over-year growth 2021-2026 (%)
- Exhibits77: Data Table on US - Year-over-year growth 2021-2026 (%)
- Exhibits78: Chart on Japan - Market size and forecast 2021-2026 ($ million)
- Exhibits79: Data Table on Japan - Market size and forecast 2021-2026 ($ million)
- Exhibits80: Chart on Japan - Year-over-year growth 2021-2026 (%)
- Exhibits81: Data Table on Japan - Year-over-year growth 2021-2026 (%)
- Exhibits82: Chart on India - Market size and forecast 2021-2026 ($ million)
- Exhibits83: Data Table on India - Market size and forecast 2021-2026 ($ million)
- Exhibits84: Chart on India - Year-over-year growth 2021-2026 (%)
- Exhibits85: Data Table on India - Year-over-year growth 2021-2026 (%)
- Exhibits86: Chart on Germany - Market size and forecast 2021-2026 ($ million)
- Exhibits87: Data Table on Germany - Market size and forecast 2021-2026 ($ million)
- Exhibits88: Chart on Germany - Year-over-year growth 2021-2026 (%)
- Exhibits89: Data Table on Germany - Year-over-year growth 2021-2026 (%)
- Exhibits90: Market opportunity By Geographical Landscape ($ million)
- Exhibits91: Impact of drivers and challenges in 2021 and 2026
- Exhibits92: Overview on Criticality of inputs and Factors of differentiation
- Exhibits93: Overview on factors of disruption
- Exhibits94: Impact of key risks on business
- Exhibits95: Vendors covered
- Exhibits96: Matrix on vendor position and classification
- Exhibits97: Alps Alpine Co. Ltd. - Overview
- Exhibits98: Alps Alpine Co. Ltd. - Business segments
- Exhibits99: Alps Alpine Co. Ltd. - Key news
- Exhibits100: Alps Alpine Co. Ltd. - Key offerings
- Exhibits101: Alps Alpine Co. Ltd. - Segment focus
- Exhibits102: Continental AG - Overview
- Exhibits103: Continental AG - Business segments
- Exhibits104: Continental AG - Key news
- Exhibits105: Continental AG - Key offerings
- Exhibits106: Continental AG - Segment focus
- Exhibits107: DENSO Corp. - Overview
- Exhibits108: DENSO Corp. - Business segments
- Exhibits109: DENSO Corp. - Key news
- Exhibits110: DENSO Corp. - Key offerings
- Exhibits111: DENSO Corp. - Segment focus
- Exhibits112: HELLA GmbH and Co. KG - Overview
- Exhibits113: HELLA GmbH and Co. KG - Business segments
- Exhibits114: HELLA GmbH and Co. KG - Key offerings
- Exhibits115: HELLA GmbH and Co. KG - Segment focus
- Exhibits116: Lear Corp. - Overview
- Exhibits117: Lear Corp. - Business segments
- Exhibits118: Lear Corp. - Key news
- Exhibits119: Lear Corp. - Key offerings
- Exhibits120: Lear Corp. - Segment focus
- Exhibits121: Mitsubishi Electric Corp. - Overview
- Exhibits122: Mitsubishi Electric Corp. - Business segments
- Exhibits123: Mitsubishi Electric Corp. - Key news
- Exhibits124: Mitsubishi Electric Corp. - Key offerings
- Exhibits125: Mitsubishi Electric Corp. - Segment focus
- Exhibits126: Robert Bosch GmbH - Overview
- Exhibits127: Robert Bosch GmbH - Business segments
- Exhibits128: Robert Bosch GmbH - Key news
- Exhibits129: Robert Bosch GmbH - Key offerings
- Exhibits130: Robert Bosch GmbH - Segment focus
- Exhibits131: Tokai Rika Co. Ltd. - Overview
- Exhibits132: Tokai Rika Co. Ltd. - Product / Service
- Exhibits133: Tokai Rika Co. Ltd. - Key offerings
- Exhibits134: Valeo SA - Overview
- Exhibits135: Valeo SA - Business segments
- Exhibits136: Valeo SA - Key offerings
- Exhibits137: Valeo SA - Segment focus
- Exhibits138: ZF Friedrichshafen AG - Overview
- Exhibits139: ZF Friedrichshafen AG - Business segments
- Exhibits140: ZF Friedrichshafen AG - Key news
- Exhibits141: ZF Friedrichshafen AG - Key offerings
- Exhibits142: ZF Friedrichshafen AG - Segment focus
- Exhibits143: Inclusions checklist
- Exhibits144: Exclusions checklist
- Exhibits145: Currency conversion rates for US$
- Exhibits146: Research methodology
- Exhibits147: Validation techniques employed for market sizing
- Exhibits148: Information sources
- Exhibits149: List of abbreviations
Technavio has been monitoring the passenger car security systems market and it is poised to grow by $ 1.14 bn during 2022-2026, decelerating at a CAGR of 3.09% during the forecast period. Our report on the passenger car security systems market provides a holistic analysis, market size and forecast, trends, growth drivers, and challenges, as well as vendor analysis covering around 25 vendors.
The report offers an up-to-date analysis regarding the current global market scenario, latest trends and drivers, and the overall market environment. The market is driven by increase in car thefts, emergence of connected cars, and rise in demand from emerging APAC countries.
The passenger car security systems market analysis includes the product segment and geographic landscape.
Technavio's passenger car security systems market is segmented as below:
By Product
- Immobilizer
- Central lock system
- Alarm system
- RKE and others
By Geographical Landscape
- APAC
- North America
- Europe
- South America
- Middle East and Africa
This study identifies the growth of biometric technology as one of the prime reasons driving the passenger car security systems market growth during the next few years. Also, increase in use of smart mobile apps for passenger cars and rise in risks associated with keyless cars will lead to sizable demand in the market.
Technavio presents a detailed picture of the market by the way of study, synthesis, and summation of data from multiple sources by an analysis of key parameters. Our report on passenger car security systems market covers the following areas:
- Passenger car security systems market sizing
- Passenger car security systems market forecast
- Passenger car security systems market industry analysis
Technavio's robust vendor analysis is designed to help clients improve their market position, and in line with this, this report provides a detailed analysis of several leading passenger car security systems market vendors that include Alps Alpine Co. Ltd., Aptiv Plc, Changhui Group, Continental AG, Crimestoppers Trust, DENSO Corp., Firstech LLC, HELLA GmbH and Co. KG, KIRAMEK inc, Lear Corp., Marquardt GmbH, Mitsubishi Electric Corp., Nostaa Group Ltd., Robert Bosch GmbH, Scorpion Automotive Ltd., Tokai Rika Co. Ltd., Valeo SA, VOXX International Corp., Xtreme Auto Glass and Window Tint, and ZF Friedrichshafen AG. Also, the passenger car security systems market analysis report includes information on upcoming trends and challenges that will influence market growth. This is to help companies strategize and leverage all forthcoming growth opportunities.
The study was conducted using an objective combination of primary and secondary information including inputs from key participants in the industry. The report contains a comprehensive market and vendor landscape in addition to an analysis of the key vendors.
Technavio presents a detailed picture of the market by the way of study, synthesis, and summation of data from multiple sources by an analysis of key parameters such as profit, pricing, competition, and promotions. It presents various market facets by identifying the key industry influencers. The data presented is comprehensive, reliable, and a result of extensive research - both primary and secondary. Technavio's market research reports provide a complete competitive landscape and an in-depth vendor selection methodology and analysis using qualitative and quantitative research to forecast the accurate market growth.
Table of Contents
1. Executive Summary
- 1.1 Market overview
- Exhibit 01: Executive Summary - Chart on Market Overview
- Exhibit 02: Executive Summary - Data Table on Market Overview
- Exhibit 03: Executive Summary - Chart on Global Market Characteristics
- Exhibit 04: Executive Summary - Chart on Market By Geographical Landscape
- Exhibit 05: Executive Summary - Chart on Market Segmentation by Product
- Exhibit 06: Executive Summary - Chart on Incremental Growth
- Exhibit 07: Executive Summary - Data Table on Incremental Growth
- Exhibit 08: Executive Summary - Chart on Vendor Market Positioning
2. Market Landscape
- 2.1 Market ecosystem
- Exhibit 09: Parent market
- Exhibit 10: Market Characteristics
3. Market Sizing
- 3.1 Market definition
- Exhibit 11: Offerings of vendors included in the market definition
- 3.2 Market segment analysis
- Exhibit 12: Market segments
- 3.3 Market size 2021
- 3.4 Market outlook: Forecast for 2021-2026
- Exhibit 13: Chart on Global - Market size and forecast 2021-2026 ($ million)
- Exhibit 14: Data Table on Global - Market size and forecast 2021-2026 ($ million)
- Exhibit 15: Chart on Global Market: Year-over-year growth 2021-2026 (%)
- Exhibit 16: Data Table on Global Market: Year-over-year growth 2021-2026 (%)
4. Five Forces Analysis
- 4.1 Five Forces Summary
- Exhibit 17: Five forces analysis - Comparison between2021 and 2026
- 4.2 Bargaining power of buyers
- Exhibit 18: Chart on Bargaining power of buyers - Impact of key factors 2021 and 2026
- 4.3 Bargaining power of suppliers
- Exhibit 19: Bargaining power of suppliers - Impact of key factors in 2021 and 2026
- 4.4 Threat of new entrants
- Exhibit 20: Threat of new entrants - Impact of key factors in 2021 and 2026
- 4.5 Threat of substitutes
- Exhibit 21: Threat of substitutes - Impact of key factors in 2021 and 2026
- 4.6 Threat of rivalry
- Exhibit 22: Threat of rivalry - Impact of key factors in 2021 and 2026
- 4.7 Market condition
- Exhibit 23: Chart on Market condition - Five forces 2021 and 2026
5. Market Segmentation by Product
- 5.1 Market segments
- Exhibit 24: Chart on Product - Market share 2021-2026 (%)
- Exhibit 25: Data Table on Product - Market share 2021-2026 (%)
- 5.2 Comparison by Product
- Exhibit 26: Chart on Comparison by Product
- Exhibit 27: Data Table on Comparison by Product
- 5.3 Immobilizer - Market size and forecast 2021-2026
- Exhibit 28: Chart on Immobilizer - Market size and forecast 2021-2026 ($ million)
- Exhibit 29: Data Table on Immobilizer - Market size and forecast 2021-2026 ($ million)
- Exhibit 30: Chart on Immobilizer - Year-over-year growth 2021-2026 (%)
- Exhibit 31: Data Table on Immobilizer - Year-over-year growth 2021-2026 (%)
- 5.4 Central lock system - Market size and forecast 2021-2026
- Exhibit 32: Chart on Central lock system - Market size and forecast 2021-2026 ($ million)
- Exhibit 33: Data Table on Central lock system - Market size and forecast 2021-2026 ($ million)
- Exhibit 34: Chart on Central lock system - Year-over-year growth 2021-2026 (%)
- Exhibit 35: Data Table on Central lock system - Year-over-year growth 2021-2026 (%)
- 5.5 Alarm system - Market size and forecast 2021-2026
- Exhibit 36: Chart on Alarm system - Market size and forecast 2021-2026 ($ million)
- Exhibit 37: Data Table on Alarm system - Market size and forecast 2021-2026 ($ million)
- Exhibit 38: Chart on Alarm system - Year-over-year growth 2021-2026 (%)
- Exhibit 39: Data Table on Alarm system - Year-over-year growth 2021-2026 (%)
- 5.6 RKE and others - Market size and forecast 2021-2026
- Exhibit 40: Chart on RKE and others - Market size and forecast 2021-2026 ($ million)
- Exhibit 41: Data Table on RKE and others - Market size and forecast 2021-2026 ($ million)
- Exhibit 42: Chart on RKE and others - Year-over-year growth 2021-2026 (%)
- Exhibit 43: Data Table on RKE and others - Year-over-year growth 2021-2026 (%)
- 5.7 Market opportunity by Product
- Exhibit 44: Market opportunity by Product ($ million)
6. Customer landscape
- Technavio's customer landscape matrix comparing Drivers or price sensitivity, Adoption lifecycle, importance in customer price basket, Adoption rate and Key purchase criteria
- 6.1 Customer landscape overview
- Exhibit 45: Analysis of price sensitivity, lifecycle, customer purchase basket, adoption rates, and purchase criteria
7. Geographic Landscape
- 7.1 Geographic segmentation
- Exhibit 46: Chart on Market share By Geographical Landscape 2021-2026 (%)
- Exhibit 47: Data Table on Market share By Geographical Landscape 2021-2026 (%)
- 7.2 Geographic comparison
- Exhibit 48: Chart on Geographic comparison
- Exhibit 49: Data Table on Geographic comparison
- 7.3 APAC - Market size and forecast 2021-2026
- Exhibit 50: Chart on APAC - Market size and forecast 2021-2026 ($ million)
- Exhibit 51: Data Table on APAC- Market size and forecast 2021-2026 ($ million)
- Exhibit 52: Chart on APAC- Year-over-year growth 2021-2026 (%)
- Exhibit 53: Data Table on APAC- Year-over-year growth 2021-2026 (%)
- 7.4 North America - Market size and forecast 2021-2026
- Exhibit 54: Chart on North America - Market size and forecast 2021-2026 ($ million)
- Exhibit 55: Data Table on North America - Market size and forecast 2021-2026 ($ million)
- Exhibit 56: Chart on North America - Year-over-year growth 2021-2026 (%)
- Exhibit 57: Data Table on North America - Year-over-year growth 2021-2026 (%)
- 7.5 Europe - Market size and forecast 2021-2026
- Exhibit 58: Chart on Europe- Market size and forecast 2021-2026 ($ million)
- Exhibit 59: Data Table on Europe- Market size and forecast 2021-2026 ($ million)
- Exhibit 60: Chart on Europe- Year-over-year growth 2021-2026 (%)
- Exhibit 61: Data Table on Europe- Year-over-year growth 2021-2026 (%)
- 7.6 South America - Market size and forecast 2021-2026
- Exhibit 62: Chart on South America - Market size and forecast 2021-2026 ($ million)
- Exhibit 63: Data Table on South America - Market size and forecast 2021-2026 ($ million)
- Exhibit 64: Chart on South America - Year-over-year growth 2021-2026 (%)
- Exhibit 65: Data Table on South America - Year-over-year growth 2021-2026 (%)
- 7.7 Middle East and Africa - Market size and forecast 2021-2026
- Exhibit 66: Chart on Middle East and Africa - Market size and forecast 2021-2026 ($ million)
- Exhibit 67: Data Table on Middle East and Africa - Market size and forecast 2021-2026 ($ million)
- Exhibit 68: Chart on Middle East and Africa - Year-over-year growth 2021-2026 (%)
- Exhibit 69: Data Table on Middle East and Africa - Year-over-year growth 2021-2026 (%)
- 7.8 China - Market size and forecast 2021-2026
- Exhibit 70: Chart on China - Market size and forecast 2021-2026 ($ million)
- Exhibit 71: Data Table on China - Market size and forecast 2021-2026 ($ million)
- Exhibit 72: Chart on China - Year-over-year growth 2021-2026 (%)
- Exhibit 73: Data Table on China - Year-over-year growth 2021-2026 (%)
- 7.9 US - Market size and forecast 2021-2026
- Exhibit 74: Chart on US - Market size and forecast 2021-2026 ($ million)
- Exhibit 75: Data Table on US - Market size and forecast 2021-2026 ($ million)
- Exhibit 76: Chart on US - Year-over-year growth 2021-2026 (%)
- Exhibit 77: Data Table on US - Year-over-year growth 2021-2026 (%)
- 7.10 Japan - Market size and forecast 2021-2026
- Exhibit 78: Chart on Japan - Market size and forecast 2021-2026 ($ million)
- Exhibit 79: Data Table on Japan - Market size and forecast 2021-2026 ($ million)
- Exhibit 80: Chart on Japan - Year-over-year growth 2021-2026 (%)
- Exhibit 81: Data Table on Japan - Year-over-year growth 2021-2026 (%)
- 7.11 India - Market size and forecast 2021-2026
- Exhibit 82: Chart on India - Market size and forecast 2021-2026 ($ million)
- Exhibit 83: Data Table on India - Market size and forecast 2021-2026 ($ million)
- Exhibit 84: Chart on India - Year-over-year growth 2021-2026 (%)
- Exhibit 85: Data Table on India - Year-over-year growth 2021-2026 (%)
- 7.12 Germany- Market size and forecast 2021-2026
- Exhibit 86: Chart on Germany- Market size and forecast 2021-2026 ($ million)
- Exhibit 87: Data Table on Germany- Market size and forecast 2021-2026 ($ million)
- Exhibit 88: Chart on Germany- Year-over-year growth 2021-2026 (%)
- Exhibit 89: Data Table on Germany- Year-over-year growth 2021-2026 (%)
- 7.13 Market opportunity By Geographical Landscape
- Exhibit 90: Market opportunity By Geographical Landscape ($ million)
8. Drivers, Challenges, and Trends
- 8.1 Market drivers
- 8.1.1 Increase in car thefts
- 8.1.2 Emergence of connected cars
- 8.1.3 Rise in demand from emerging APAC countries
- 8.2 Market challenges
- 8.2.1 Slowdown in automobile manufacturing
- 8.2.2 High cost of premium security features
- 8.2.3 Potential failure of electronic components used in vehicle security systems
- 8.3 Impact of drivers and challenges
- Exhibit 91: Impact of drivers and challenges in 2021 and 2026
- 8.4 Market trends
- 8.4.1 Growth of biometric technology
- 8.4.2 Increase in use of smart mobile apps for passenger cars
- 8.4.3 Rise in risks associated with keyless cars
9. Vendor Landscape
- 9.1 Overview
- 9.2 Vendor landscape
- Exhibit 92: Overview on Criticality of inputs and Factors of differentiation
- 9.3 Landscape disruption
- Exhibit 93: Overview on factors of disruption
- 9.4 Industry risks
- Exhibit 94: Impact of key risks on business
10. Vendor Analysis
- 10.1 Vendors covered
- Exhibit 95: Vendors covered
- 10.2 Market positioning of vendors
- Exhibit 96: Matrix on vendor position and classification
- 10.3 Alps Alpine Co. Ltd.
- Exhibit 97: Alps Alpine Co. Ltd. - Overview
- Exhibit 98: Alps Alpine Co. Ltd. - Business segments
- Exhibit 99: Alps Alpine Co. Ltd. - Key news
- Exhibit 100: Alps Alpine Co. Ltd. - Key offerings
- Exhibit 101: Alps Alpine Co. Ltd. - Segment focus
- 10.4 Continental AG
- Exhibit 102: Continental AG - Overview
- Exhibit 103: Continental AG - Business segments
- Exhibit 104: Continental AG - Key news
- Exhibit 105: Continental AG - Key offerings
- Exhibit 106: Continental AG - Segment focus
- 10.5 DENSO Corp.
- Exhibit 107: DENSO Corp. - Overview
- Exhibit 108: DENSO Corp. - Business segments
- Exhibit 109: DENSO Corp. - Key news
- Exhibit 110: DENSO Corp. - Key offerings
- Exhibit 111: DENSO Corp. - Segment focus
- 10.6 HELLA GmbH and Co. KG
- Exhibit 112: HELLA GmbH and Co. KG - Overview
- Exhibit 113: HELLA GmbH and Co. KG - Business segments
- Exhibit 114: HELLA GmbH and Co. KG - Key offerings
- Exhibit 115: HELLA GmbH and Co. KG - Segment focus
- 10.7 Lear Corp.
- Exhibit 116: Lear Corp. - Overview
- Exhibit 117: Lear Corp. - Business segments
- Exhibit 118: Lear Corp. - Key news
- Exhibit 119: Lear Corp. - Key offerings
- Exhibit 120: Lear Corp. - Segment focus
- 10.8 Mitsubishi Electric Corp.
- Exhibit 121: Mitsubishi Electric Corp. - Overview
- Exhibit 122: Mitsubishi Electric Corp. - Business segments
- Exhibit 123: Mitsubishi Electric Corp. - Key news
- Exhibit 124: Mitsubishi Electric Corp. - Key offerings
- Exhibit 125: Mitsubishi Electric Corp. - Segment focus
- 10.9 Robert Bosch GmbH
- Exhibit 126: Robert Bosch GmbH - Overview
- Exhibit 127: Robert Bosch GmbH - Business segments
- Exhibit 128: Robert Bosch GmbH - Key news
&am