|
|
市場調査レポート
商品コード
1132186
ITアウトソーシングの世界市場 2022-2026Global IT Outsourcing Market 2022-2026 |
||||||
|
|
|||||||
|
● お客様のご希望に応じて、既存データの加工や未掲載情報(例:国別セグメント)の追加などの対応が可能です。 詳細はお問い合わせください。 |
|||||||


| ITアウトソーシングの世界市場 2022-2026 |
|
出版日: 2022年09月05日
発行: TechNavio
ページ情報: 英文 120 Pages
納期: 即納可能
|
- 全表示
- 概要
- 図表
- 目次
当レポートによるとITアウトソーシングの市場規模は、2022年から2026年の間に1億1724万米ドル、予測期間中のCAGRは4.12%で成長すると予測しています。
当レポートでは、ITアウトソーシング市場の全体分析、市場規模・予測、動向、成長促進要因・課題、約25社のベンダーを網羅したベンダー分析などをお届けします。
レポートでは、現在の世界の市場動向と促進要因、市場全体の環境について最新の分析を行っています。市場は、ビジネスプロセスの最適化の必要性、規制ガイドラインの遵守とコンプライアンスの確保、SOAの普及の高まりなどによって牽引されています。
本調査では、今後数年間のITアウトソーシング市場の成長を牽引する主な要因の1つとして、アプリケーションのアウトソーシング統合の増加を挙げています。また、組織におけるデジタル変革の進展や、CAPEXモデルからOPEXモデルへの移行が進んでいることも、市場の大きな需要につながると考えられます。
目次
第1章 エグゼクティブサマリー
- 市場概要
第2章 市場情勢
- 市場エコシステム
第3章 市場規模
- 市場の定義
- 市場セグメント分析
- 市場規模 2021
- 市場の見通し:2021-2026年の予測
第4章 ファイブフォース分析
- ファイブフォースまとめ
- 買い手の交渉力
- 供給企業の交渉力
- 新規参入業者の脅威
- 代替品の脅威
- 競争の脅威
- 市況
第5章 サービス別市場セグメンテーション
- 市場内訳
- サービス別比較
- インフラストラクチャアウトソーシング - 市場規模と予測 2021-2026
- アプリケーションアウトソーシング - 市場規模と予測 2021-2026
- サービス別の市場機会
第6章 顧客情勢
- 顧客情勢の概要
- 促進要因または価格感度、採用ライフサイクル、顧客価格バスケットにおける重要性、採用率、および主要な購入基準を比較するTechnavioの顧客情勢マトリックス
第7章 地域別情勢
- 地域別セグメンテーション
- 地域別比較
- APAC - 市場規模と予測 2021-2026
- 南米 - 市場規模と予測 2021-2026
- 中東およびアフリカ - 市場規模と予測 2021-2026
- 北米 - 市場規模と予測 2021-2026
- 欧州 - 市場規模と予測 2021-2026
- 米国 - 市場規模と予測 2021-2026
- 英国 - 市場規模と予測 2021-2026
- 中国 - 市場規模と予測 2021-2026
- ドイツ - 市場規模と予測 2021-2026
- 日本 - 市場規模と予測 2021-2026
- 地域情勢別の市場機会
第8章 促進要因、課題、および動向
- 市場促進要因
- ビジネスプロセスを最適化する必要がある
- 規制ガイドラインを遵守し、コンプライアンスを確保する必要がある
- SOAの人気の高まり
- 市場の課題
- クラウドベースのサービスにおけるデータのプライバシーとセキュリティのリスク
- 熟練したITプロフェッショナルの不足
- SLAにおける品質基準の欠如
- 促進要因と課題の影響
- 市場動向
- アプリケーションアウトソーシングの統合の台頭
- 組織におけるデジタルトランスフォーメーションの拡大
- CAPEXモデルからOPEXモデルへのシフトの拡大
第9章 ベンダー情勢
- 概要
- ベンダー情勢
- 2020年の市場情勢の混乱の可能性は中程度であり、その脅威は2025年まで変わらないと予想されます。
- 混乱の状況
- 業界のリスク
第10章 ベンダー分析
- 対象ベンダー
- ベンダーの市場ポジショニング
- アクセンチュア
- キャップジェミニサービス SAS
- 富士通株式会社
- HCLテクノロジーズ株式会社
- Hewlett Packard Enterprise Co.
- インターナショナル・ビジネス・マシーンズ・コーポレーション
- Larsen and Toubro Ltd.
- タタコンサルタンシーサービスリミテッド
- テックマヒンドラ株式会社
Exhibits:
- Exhibits1: Executive Summary - Chart on Market Overview
- Exhibits2: Executive Summary - Data Table on Market Overview
- Exhibits3: Executive Summary - Chart on Global Market Characteristics
- Exhibits4: Executive Summary - Chart on Market By Geographical Landscape
- Exhibits5: Executive Summary - Chart on Market Segmentation by Service
- Exhibits6: Executive Summary - Chart on Incremental Growth
- Exhibits7: Executive Summary - Data Table on Incremental Growth
- Exhibits8: Executive Summary - Chart on Vendor Market Positioning
- Exhibits9: Parent market
- Exhibits10: Market Characteristics
- Exhibits11: Offerings of vendors included in the market definition
- Exhibits12: Market segments
- Exhibits13: Chart on Global - Market size and forecast 2021-2026 ($ million)
- Exhibits14: Data Table on Global - Market size and forecast 2021-2026 ($ million)
- Exhibits15: Chart on Global Market: Year-over-year growth 2021-2026 (%)
- Exhibits16: Data Table on Global Market: Year-over-year growth 2021-2026 (%)
- Exhibits17: Five forces analysis - Comparison between 2021 and 2026
- Exhibits18: Chart on Bargaining power of buyers - Impact of key factors 2021 and 2026
- Exhibits19: Bargaining power of suppliers - Impact of key factors in 2021 and 2026
- Exhibits20: Threat of new entrants - Impact of key factors in 2021 and 2026
- Exhibits21: Threat of substitutes - Impact of key factors in 2021 and 2026
- Exhibits22: Threat of rivalry - Impact of key factors in 2021 and 2026
- Exhibits23: Chart on Market condition - Five forces 2021 and 2026
- Exhibits24: Chart on Service - Market share 2021-2026 (%)
- Exhibits25: Data Table on Service - Market share 2021-2026 (%)
- Exhibits26: Chart on Comparison by Service
- Exhibits27: Data Table on Comparison by Service
- Exhibits28: Chart on Infrastructure outsourcing - Market size and forecast 2021-2026 ($ million)
- Exhibits29: Data Table on Infrastructure outsourcing - Market size and forecast 2021-2026 ($ million)
- Exhibits30: Chart on Infrastructure outsourcing - Year-over-year growth 2021-2026 (%)
- Exhibits31: Data Table on Infrastructure outsourcing - Year-over-year growth 2021-2026 (%)
- Exhibits32: Chart on Application outsourcing - Market size and forecast 2021-2026 ($ million)
- Exhibits33: Data Table on Application outsourcing - Market size and forecast 2021-2026 ($ million)
- Exhibits34: Chart on Application outsourcing - Year-over-year growth 2021-2026 (%)
- Exhibits35: Data Table on Application outsourcing - Year-over-year growth 2021-2026 (%)
- Exhibits36: Market opportunity by Service ($ million)
- Exhibits37: Analysis of price sensitivity, lifecycle, customer purchase basket, adoption rates, and purchase criteria
- Exhibits38: Chart on Market share By Geographical Landscape 2021-2026 (%)
- Exhibits39: Data Table on Market share By Geographical Landscape 2021-2026 (%)
- Exhibits40: Chart on Geographic comparison
- Exhibits41: Data Table on Geographic comparison
- Exhibits42: Chart on North America - Market size and forecast 2021-2026 ($ million)
- Exhibits43: Data Table on North America - Market size and forecast 2021-2026 ($ million)
- Exhibits44: Chart on North America - Year-over-year growth 2021-2026 (%)
- Exhibits45: Data Table on North America - Year-over-year growth 2021-2026 (%)
- Exhibits46: Chart on Europe - Market size and forecast 2021-2026 ($ million)
- Exhibits47: Data Table on Europe - Market size and forecast 2021-2026 ($ million)
- Exhibits48: Chart on Europe - Year-over-year growth 2021-2026 (%)
- Exhibits49: Data Table on Europe - Year-over-year growth 2021-2026 (%)
- Exhibits50: Chart on APAC - Market size and forecast 2021-2026 ($ million)
- Exhibits51: Data Table on APAC - Market size and forecast 2021-2026 ($ million)
- Exhibits52: Chart on APAC - Year-over-year growth 2021-2026 (%)
- Exhibits53: Data Table on APAC - Year-over-year growth 2021-2026 (%)
- Exhibits54: Chart on South America - Market size and forecast 2021-2026 ($ million)
- Exhibits55: Data Table on South America - Market size and forecast 2021-2026 ($ million)
- Exhibits56: Chart on South America - Year-over-year growth 2021-2026 (%)
- Exhibits57: Data Table on South America - Year-over-year growth 2021-2026 (%)
- Exhibits58: Chart on Middle East and Africa - Market size and forecast 2021-2026 ($ million)
- Exhibits59: Data Table on Middle East and Africa - Market size and forecast 2021-2026 ($ million)
- Exhibits60: Chart on Middle East and Africa - Year-over-year growth 2021-2026 (%)
- Exhibits61: Data Table on Middle East and Africa - Year-over-year growth 2021-2026 (%)
- Exhibits62: Chart on US - Market size and forecast 2021-2026 ($ million)
- Exhibits63: Data Table on US - Market size and forecast 2021-2026 ($ million)
- Exhibits64: Chart on US - Year-over-year growth 2021-2026 (%)
- Exhibits65: Data Table on US - Year-over-year growth 2021-2026 (%)
- Exhibits66: Chart on UK - Market size and forecast 2021-2026 ($ million)
- Exhibits67: Data Table on UK - Market size and forecast 2021-2026 ($ million)
- Exhibits68: Chart on UK - Year-over-year growth 2021-2026 (%)
- Exhibits69: Data Table on UK - Year-over-year growth 2021-2026 (%)
- Exhibits70: Chart on China - Market size and forecast 2021-2026 ($ million)
- Exhibits71: Data Table on China - Market size and forecast 2021-2026 ($ million)
- Exhibits72: Chart on China - Year-over-year growth 2021-2026 (%)
- Exhibits73: Data Table on China - Year-over-year growth 2021-2026 (%)
- Exhibits74: Chart on Germany - Market size and forecast 2021-2026 ($ million)
- Exhibits75: Data Table on Germany - Market size and forecast 2021-2026 ($ million)
- Exhibits76: Chart on Germany - Year-over-year growth 2021-2026 (%)
- Exhibits77: Data Table on Germany - Year-over-year growth 2021-2026 (%)
- Exhibits78: Chart on Japan - Market size and forecast 2021-2026 ($ million)
- Exhibits79: Data Table on Japan - Market size and forecast 2021-2026 ($ million)
- Exhibits80: Chart on Japan - Year-over-year growth 2021-2026 (%)
- Exhibits81: Data Table on Japan - Year-over-year growth 2021-2026 (%)
- Exhibits82: Market opportunity By Geographical Landscape ($ million)
- Exhibits83: Impact of drivers and challenges in 2021 and 2026
- Exhibits84: Overview on Criticality of inputs and Factors of differentiation
- Exhibits85: Overview on factors of disruption
- Exhibits86: Impact of key risks on business
- Exhibits87: Vendors covered
- Exhibits88: Matrix on vendor position and classification
- Exhibits89: Accenture Plc - Overview
- Exhibits90: Accenture Plc - Business segments
- Exhibits91: Accenture Plc - Key news
- Exhibits92: Accenture Plc - Key offerings
- Exhibits93: Accenture Plc - Segment focus
- Exhibits94: Capgemini Service SAS - Overview
- Exhibits95: Capgemini Service SAS - Business segments
- Exhibits96: Capgemini Service SAS - Key news
- Exhibits97: Capgemini Service SAS - Key offerings
- Exhibits98: Capgemini Service SAS - Segment focus
- Exhibits99: Fujitsu Ltd. - Overview
- Exhibits100: Fujitsu Ltd. - Business segments
- Exhibits101: Fujitsu Ltd. - Key offerings
- Exhibits102: Fujitsu Ltd. - Segment focus
- Exhibits103: HCL Technologies Ltd. - Overview
- Exhibits104: HCL Technologies Ltd. - Business segments
- Exhibits105: HCL Technologies Ltd. - Key offerings
- Exhibits106: HCL Technologies Ltd. - Segment focus
- Exhibits107: Hewlett Packard Enterprise Co. - Overview
- Exhibits108: Hewlett Packard Enterprise Co. - Business segments
- Exhibits109: Hewlett Packard Enterprise Co. - Key news
- Exhibits110: Hewlett Packard Enterprise Co. - Key offerings
- Exhibits111: Hewlett Packard Enterprise Co. - Segment focus
- Exhibits112: International Business Machines Corp. - Overview
- Exhibits113: International Business Machines Corp. - Business segments
- Exhibits114: International Business Machines Corp. - Key offerings
- Exhibits115: International Business Machines Corp. - Segment focus
- Exhibits116: Larsen and Toubro Ltd. - Overview
- Exhibits117: Larsen and Toubro Ltd. - Business segments
- Exhibits118: Larsen and Toubro Ltd. - Key news
- Exhibits119: Larsen and Toubro Ltd. - Key offerings
- Exhibits120: Larsen and Toubro Ltd. - Segment focus
- Exhibits121: Tata Consultancy Services Ltd. - Overview
- Exhibits122: Tata Consultancy Services Ltd. - Business segments
- Exhibits123: Tata Consultancy Services Ltd. - Key news
- Exhibits124: Tata Consultancy Services Ltd. - Key offerings
- Exhibits125: Tata Consultancy Services Ltd. - Segment focus
- Exhibits126: Tech Mahindra Ltd - Overview
- Exhibits127: Tech Mahindra Ltd - Business segments
- Exhibits128: Tech Mahindra Ltd - Key offerings
- Exhibits129: Tech Mahindra Ltd - Segment focus
- Exhibits130: Wipro Ltd. - Overview
- Exhibits131: Wipro Ltd. - Business segments
- Exhibits132: Wipro Ltd. - Key news
- Exhibits133: Wipro Ltd. - Key offerings
- Exhibits134: Wipro Ltd. - Segment focus
- Exhibits135: Inclusions checklist
- Exhibits136: Exclusions checklist
- Exhibits137: Currency conversion rates for US$
- Exhibits138: Research methodology
- Exhibits139: Validation techniques employed for market sizing
- Exhibits140: Information sources
- Exhibits141: List of abbreviations
Technavio has been monitoring the IT outsourcing market and it is poised to grow by $117.24 mn during 2022-2026, decelerating at a CAGR of 4.12% during the forecast period. Our report on the IT outsourcing market provides a holistic analysis, market size and forecast, trends, growth drivers, and challenges, as well as vendor analysis covering around 25 vendors.
The report offers an up-to-date analysis of the current global market scenario, the latest trends and drivers, and the overall market environment. The market is driven by the need to optimize business processes, the need to adhere to regulatory guidelines and ensure compliance, and the rising popularity of SOA.
The IT outsourcing market analysis includes the service segment and geographic landscape.
Technavio's IT outsourcing market is segmented as below:
By Service
- Infrastructure outsourcing
- Application outsourcing
By Geographical Landscape
- North America
- Europe
- APAC
- South America
- Middle East and Africa
This study identifies the rise in the integration of application outsourcing as one of the prime reasons driving the IT outsourcing market growth during the next few years. Also, growing digital transformation in organizations and growing shifts from the CAPEX model to the OPEX model will lead to sizable demand in the market.
Technavio presents a detailed picture of the market through study, synthesis, and summation of data from multiple sources by analyzing key parameters. Our report on the IT outsourcing market covers the following areas:
- IT outsourcing market sizing
- IT outsourcing market forecast
- IT outsourcing market industry analysis
Technavio's robust vendor analysis is designed to help clients improve their market position, and in line with this, this report provides a detailed analysis of several leading IT outsourcing market vendors that include Accenture Plc, Acora Ltd, Amdocs Ltd., Atos SE, Capgemini Service SAS, CGI Inc, Cognizant Technology Solutions Corp., Fujitsu Ltd., Genpact Ltd., HCL Technologies Ltd., Hewlett Packard Enterprise Co., Infosys Ltd., International Business Machines Corp., ITC infotech India Ltd., Tata Consultancy Services Ltd., Tech Mahindra Ltd, Unisys Corp., Wipro Ltd., Xerox Holdings Corp., and Larsen and Toubro Ltd. Also, the IT outsourcing market analysis report includes information on upcoming trends and challenges that will influence market growth. This is to help companies strategize and leverage all future growth opportunities.
The study was conducted using an objective combination of primary and secondary information including inputs from key participants in the industry. The report contains a comprehensive market and vendor landscape in addition to an analysis of the key vendors.
Technavio presents a detailed picture of the market through study, synthesis, and summation of data from multiple sources by analyzing key parameters such as profit, pricing, competition, and promotions. It presents various market facets by identifying the key industry influencers. The data presented is comprehensive, reliable, and a result of extensive research - both primary and secondary. Technavio's market research reports provide a complete competitive landscape and an in-depth vendor selection methodology and analysis using qualitative and quantitative research to forecast accurate market growth.
Table of Contents
1. Executive Summary
- 1.1 Market Overview
- Exhibit 01: Executive Summary - Chart on Market Overview
- Exhibit 02: Executive Summary - Data Table on Market Overview
- Exhibit 03: Executive Summary - Chart on Global Market Characteristics
- Exhibit 04: Executive Summary - Chart on Market By Geographical Landscape
- Exhibit 05: Executive Summary - Chart on Market Segmentation by Service
- Exhibit 06: Executive Summary - Chart on Incremental Growth
- Exhibit 07: Executive Summary - Data Table on Incremental Growth
- Exhibit 08: Executive Summary - Chart on Vendor Market Positioning
2. Market Landscape
- 2.1 Market ecosystem
- Exhibit 09: Parent market
- Exhibit 10: Market characteristics
3. Market Sizing
- 3.1 Market definition
- Exhibit 11: Offerings of vendors included in the market definition
- 3.2 Market segment analysis
- Exhibit 12: Market segments
- 3.3 Market size 2021
- 3.4 Market outlook: Forecast for 2021 - 2026
- Exhibit 13: Chart on Global - Market size and forecast 2021-2026 ($ million)
- Exhibit 14: Data Table on Global - Market size and forecast 2021-2026 ($ million)
- Exhibit 15: Chart on Global Market: Year-over-year growth 2021-2026 (%)
- Exhibit 16: Data Table on Global Market: Year-over-year growth 2021-2026 (%)
4. Five Forces Analysis
- 4.1 Five Forces Summary
- Exhibit 17: Five forces analysis - Comparison between 2021 and 2026
- 4.2 Bargaining power of buyers
- Exhibit 18: Bargaining power of buyers - Impact of key factors in 2021 and 2026
- 4.3 Bargaining power of suppliers
- Exhibit 19: Bargaining power of suppliers - Impact of key factors in 2021 and 2026
- 4.4 Threat of new entrants
- Exhibit 20: Threat of new entrants - Impact of key factors in 2021 and 2026
- 4.5 Threat of substitutes
- Exhibit 21: Threat of substitutes - Impact of key factors in 2021 and 2026
- 4.6 Threat of rivalry
- Exhibit 22: Threat of rivalry - Impact of key factors in 2021 and 2026
- 4.7 Market condition
- Exhibit 23: Chart on Market condition - Five forces 2021 and 2026
5 Market Segmentation by Service
- 5.1 Market segments
- Exhibit 24: Chart on Service - Market share 2021-2026 (%)
- Exhibit 25: Data Table on Service - Market share 2021-2026 (%)
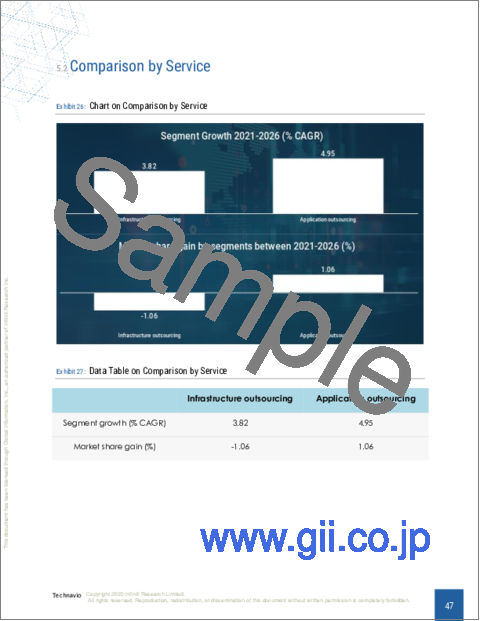
- 5.2 Comparison by Service
- Exhibit 26: Chart on Comparison by Service
- Exhibit 27: Data Table on Comparison by Service
- 5.3 Infrastructure outsourcing - Market size and forecast 2021-2026
- Exhibit 28: Chart on Infrastructure outsourcing - Market size and forecast 2021-2026 ($ million)
- Exhibit 29: Data Table on Infrastructure outsourcing - Market size and forecast 2021-2026 ($ million)
- Exhibit 30: Chart on Infrastructure outsourcing - Year-over-year growth 2021-2026 (%)
- Exhibit 31: Data Table on Infrastructure outsourcing - Year-over-year growth 2021-2026 (%)
- 5.4 Application outsourcing - Market size and forecast 2021-2026
- Exhibit 32: Chart on Application outsourcing - Market size and forecast 2021-2026 ($ million)
- Exhibit 33: Data Table on Application outsourcing - Market size and forecast 2021-2026 ($ million)
- Exhibit 34: Chart on Application outsourcing - Year-over-year growth 2021-2026 (%)
- Exhibit 35: Data Table on Application outsourcing - Year-over-year growth 2021-2026 (%)
- 5.5 Market opportunity by Service
- Exhibit 36: Market opportunity by Service ($ million)
6. Customer landscape
- 6.1 Customer landscape overview
- Technavio's customer landscape matrix comparing Drivers or price sensitivity, Adoption lifecycle, importance in customer price basket, Adoption rate and Key purchase criteria
- Exhibit 37: Analysis of price sensitivity, lifecycle, customer purchase basket, adoption rates, and purchase criteria
7. Geographic Landscape
- 7.1 Geographic segmentation
- Exhibit 38: Chart on Market share By Geographical Landscape 2021-2026 (%)
- Exhibit 39: Data Table on Market share By Geographical Landscape 2021-2026 (%)
- 7.2 Geographic comparison
- Exhibit 40: Chart on Geographic comparison
- Exhibit 41: Data Table on Geographic comparison
- 7.3 APAC - Market size and forecast 2021-2026
- Exhibit 42: Chart on APAC - Market size and forecast 2021-2026 ($ million)
- Exhibit 43: Data Table on APAC - Market size and forecast 2021-2026 ($ million)
- Exhibit 44: Chart on APAC - Year-over-year growth 2021-2026 (%)
- Exhibit 45: Data Table on APAC - Year-over-year growth 2021-2026 (%)
- 7.4 South America - Market size and forecast 2021-2026
- Exhibit 46: Chart on South America - Market size and forecast 2021-2026 ($ million)
- Exhibit 47: Data Table on South America - Market size and forecast 2021-2026 ($ million)
- Exhibit 48: Chart on South America - Year-over-year growth 2021-2026 (%)
- Exhibit 49: Data Table on South America - Year-over-year growth 2021-2026 (%)
- 7.5 Middle East and Africa - Market size and forecast 2021-2026
- Exhibit 50: Chart on Middle East and Africa - Market size and forecast 2021-2026 ($ million)
- Exhibit 51: Data Table on Middle East and Africa - Market size and forecast 2021-2026 ($ million)
- Exhibit 52: Chart on Middle East and Africa - Year-over-year growth 2021-2026 (%)
- Exhibit 53: Data Table on Middle East and Africa - Year-over-year growth 2021-2026 (%)
- 7.6 North America - Market size and forecast 2021-2026
- Exhibit 54: Chart on North America - Market size and forecast 2021-2026 ($ million)
- Exhibit 55: Data Table on North America - Market size and forecast 2021-2026 ($ million)
- Exhibit 56: Chart on North America - Year-over-year growth 2021-2026 (%)
- Exhibit 57: Data Table on North America - Year-over-year growth 2021-2026 (%)
- 7.7 Europe - Market size and forecast 2021-2026
- Exhibit 58: Chart on Europe - Market size and forecast 2021-2026 ($ million)
- Exhibit 59: Data Table on Europe - Market size and forecast 2021-2026 ($ million)
- Exhibit 60: Chart on Europe - Year-over-year growth 2021-2026 (%)
- Exhibit 61: Data Table on Europe - Year-over-year growth 2021-2026 (%)
- 7.8 US - Market size and forecast 2021-2026
- Exhibit 62: Chart on US - Market size and forecast 2021-2026 ($ million)
- Exhibit 63: Data Table on US - Market size and forecast 2021-2026 ($ million)
- Exhibit 64: Chart on US - Year-over-year growth 2021-2026 (%)
- Exhibit 65: Data Table on US - Year-over-year growth 2021-2026 (%)
- 7.9 UK - Market size and forecast 2021-2026
- Exhibit 66: Chart on UK - Market size and forecast 2021-2026 ($ million)
- Exhibit 67: Data Table on UK - Market size and forecast 2021-2026 ($ million)
- Exhibit 68: Chart on UK - Year-over-year growth 2021-2026 (%)
- Exhibit 69: Data Table on UK - Year-over-year growth 2021-2026 (%)
- 7.10 China - Market size and forecast 2021-2026
- Exhibit 70: Chart on China - Market size and forecast 2021-2026 ($ million)
- Exhibit 71: Data Table on China - Market size and forecast 2021-2026 ($ million)
- Exhibit 72: Chart on China - Year-over-year growth 2021-2026 (%)
- Exhibit 73: Data Table on China - Year-over-year growth 2021-2026 (%)
- 7.11 Germany - Market size and forecast 2021-2026
- Exhibit 74: Chart on Germany - Market size and forecast 2021-2026 ($ million)
- Exhibit 75: Data Table on Germany - Market size and forecast 2021-2026 ($ million)
- Exhibit 76: Chart on Germany - Year-over-year growth 2021-2026 (%)
- Exhibit 77: Data Table on Germany - Year-over-year growth 2021-2026 (%)
- 7.12 Japan - Market size and forecast 2021-2026
- Exhibit 78: Chart on Japan - Market size and forecast 2021-2026 ($ million)
- Exhibit 79: Data Table on Japan - Market size and forecast 2021-2026 ($ million)
- Exhibit 80: Chart on Japan - Year-over-year growth 2021-2026 (%)
- Exhibit 81: Data Table on Japan - Year-over-year growth 2021-2026 (%)
- 7.13 Market opportunity By Geographical Landscape
- Exhibit 82: Market opportunity By Geographical Landscape ($ million)
8. Drivers, Challenges, and Trends
- 8.1 Market drivers
- 8.1.1 Need to optimize business processes
- 8.1.2 Need to adhere to regulatory guidelines and ensure compliance
- 8.1.3 Rising popularity of SOA
- 8.2 Market challenges
- 8.2.1 Data privacy and security risks in cloud-based services
- 8.2.2 Shortage of skilled IT professionals
- 8.2.3 Lack of quality standards in SLAs
- 8.3 Impact of drivers and challenges
- Exhibit 83: Impact of drivers and challenges in 2021 and 2026
- 8.4 Market trends
- 8.4.1 Rise in the integration of application outsourcing
- 8.4.2 Growing digital transformation in organizations
- 8.4.3 Growing shifts from the CAPEX model to the OPEX model
9. Vendor Landscape
- 9.1 Overview
- 9.2 Vendor landscape
- Exhibit 84: Overview on Criticality of inputs and Factors of differentiation
- The potential for the disruption of the market landscape was moderate in 2020, and its threat is expected to remain unchanged by 2025.
- 9.3 Landscape disruption
- Exhibit 85: Overview on factors of disruption
- 9.4 Industry risks
- Exhibit 86: Impact of key risks on business
10. Vendor Analysis
- 10.1 Vendors covered
- Exhibit 87: Vendors covered
- 10.2 Market positioning of vendors
- Exhibit 88: Matrix on vendor position and classification
- 10.3 Accenture Plc
- Exhibit 89: Accenture Plc - Overview
- Exhibit 90: Accenture Plc - Business segments
- Exhibit 91: Accenture Plc - Key news
- Exhibit 92: Accenture Plc - Key offerings
- Exhibit 93: Accenture Plc - Segment focus
- 10.4 Capgemini Service SAS
- Exhibit 94: Capgemini Service SAS - Overview
- Exhibit 95: Capgemini Service SAS - Business segments
- Exhibit 96: Capgemini Service SAS - Key news
- Exhibit 97: Capgemini Service SAS - Key offerings
- Exhibit 98: Capgemini Service SAS - Segment focus
- 10.5 Fujitsu Ltd.
- Exhibit 99: Fujitsu Ltd. - Overview
- Exhibit 100: Fujitsu Ltd. - Business segments
- Exhibit 101: Fujitsu Ltd. - Key offerings
- Exhibit 102: Fujitsu Ltd. - Segment focus
- 10.6 HCL Technologies Ltd.
- Exhibit 103: HCL Technologies Ltd. - Overview
- Exhibit 104: HCL Technologies Ltd. - Business segments
- Exhibit 105: HCL Technologies Ltd. - Key offerings
- Exhibit 106: HCL Technologies Ltd. - Segment focus
- 10.7 Hewlett Packard Enterprise Co.
- Exhibit 107: Hewlett Packard Enterprise Co. - Overview
- Exhibit 108: Hewlett Packard Enterprise Co. - Business segments
- Exhibit 109: Hewlett Packard Enterprise Co. - Key news
- Exhibit 110: Hewlett Packard Enterprise Co. - Key offerings
- Exhibit 111: Hewlett Packard Enterprise Co. - Segment focus
- 10.8 International Business Machines Corp.
- Exhibit 112: International Business Machines Corp. - Overview
- Exhibit 113: International Business Machines Corp. - Business segments
- Exhibit 114: International Business Machines Corp. - Key offerings
- Exhibit 115: International Business Machines Corp. - Segment focus
- 10.9 Larsen and Toubro Ltd.
- Exhibit 116: Larsen and Toubro Ltd. - Overview
- Exhibit 117: Larsen and Toubro Ltd. - Business segments
- Exhibit 118: Larsen and Toubro Ltd. - Key news
- Exhibit 119: Larsen and Toubro Ltd. - Key offerings
- Exhibit 120: Larsen and Toubro Ltd. - Segment focus
- 10.10 Tata Consultancy Services Ltd.
- Exhibit 121: Tata Consultancy Services Ltd. - Overview
- Exhibit 122: Tata Consultancy Services Ltd. - Business segments
- Exhibit 123: Tata Consultancy Services Ltd. - Key news
- Exhibit 124: Tata Consultancy Services Ltd. - Key offerings
- Exhibit 125: Tata Consultancy Services Ltd. - Segment focus
- 10.11 Tech Mahindra Ltd
- Exhibit 126: Tech Mahindra Ltd - Overview
- Exhibit 127: Tech Mahindra Ltd - Business segments
&a